
ISO Test Standards
ISO 2409: Paints and Varnishes — Cross-cut Test: Essential Guide to Evaluating Coating Adhesion in the Finishing Industry
ISO 2409 is a global standard that helps check how well paint and coatings stick to surfaces. This test, known as the cross-cut test, is simple yet powerful for quality control in manufacturing and construction. The cross-cut test works by making a grid pattern of cuts through the coating down to the substrate, then applying and removing tape to see if any coating comes off.

The test is widely used for products like painted metal parts, coated wood, and plastic items. It helps manufacturers ensure their coatings will last in real-world conditions. You can perform this test with basic tools including a cutting tool, tape, and a brush. The results are rated on a scale from 0 (perfect adhesion) to 5 (severe flaking).
While ISO 2409 focuses specifically on coating adhesion, it complements other tests like impact resistance and flexibility testing. You might need all these tests to fully understand how a coating will perform over time. The cross-cut test is valuable because it quickly identifies potential coating failures before products reach customers.
Key Takeaways
- ISO 2409 provides a standardized method to evaluate coating adhesion through a simple cross-cut pattern and tape test.
- You can apply this test to various materials including metal, wood, and plastics with coating thicknesses up to 250 μm.
- Results from the cross-cut test help predict real-world coating performance and prevent premature coating failures.
Purpose and Scope of ISO 2409

ISO 2409 establishes a standardized method for assessing the resistance of paint coatings to separation from substrates when a right-angle lattice pattern is cut into the coating. This test helps you determine coating adhesion quality on various surfaces through a simple yet effective evaluation system.
Evaluation Objectives
ISO 2409 aims to measure how well paints and varnishes adhere to their substrate. The test evaluates the resistance of coatings to separation by creating a cross-cut pattern and applying adhesive tape over it. After removing the tape, you examine how much coating has detached.
Results are rated on a 0-5 scale, where 0 indicates perfect adhesion (no detachment) and 5 represents severe detachment (more than 65% of the area). This quantitative assessment helps you objectively compare different coating systems.
The standard includes specific evaluation criteria and photographic references to ensure consistent rating across different testers and laboratories.
Intended Applications
You can apply ISO 2409 to single or multi-coat systems on rigid substrates like metal, wood, and plastics. The test works best on coatings up to 250 μm thick, with modified procedures for thicknesses between 60-120 μm and 121-250 μm.
This test is particularly valuable for:
- Production quality control processes
- Coating development and formulation work
- Evaluating existing coatings on structures
- Comparing different coating systems’ performance
- Assessing substrate preparation methods
The standard isn’t suitable for coatings on non-rigid substrates or those exceeding 250 μm in thickness, as other test methods are more appropriate.
Key Benefits Across Industries
ISO 2409 offers significant advantages in multiple sectors due to its simplicity and reliability. In automotive manufacturing, you can quickly assess paint adhesion on metal parts before vehicles leave production lines.
In construction, the test helps you verify protective coatings on structural elements. Maintenance teams use it to determine if existing coatings need replacement.
Benefits include:
- Cost-effectiveness: Requires minimal equipment
- Ταχύτητα: Complete tests in minutes
- Portability: Can be performed in field conditions
- Versatility: Works across various coating types
- Standardization: Globally recognized methodology
The test allows early detection of adhesion problems, potentially saving significant remediation costs when coating failures might otherwise occur after installation.
Principles Behind the Cross-Cut Test

The cross-cut test defined in ISO 2409 relies on fundamental principles of coating adhesion and surface science. The test creates a standardized way to evaluate how well paints and coatings stick to their substrates under controlled conditions.
Mechanism of Adhesion Assessment
The cross-cut test works by deliberately disturbing the coating system with precise cuts that penetrate through to the substrate. When you create these cuts, you’re testing the bond strength between the coating and the surface below it.
The intersecting cuts introduce stress at the coating-substrate interface. This stress reveals weaknesses in adhesion that might not be visible under normal conditions. Poor adhesion shows up when coating pieces detach from the substrate.
The test simulates real-world mechanical stresses that coatings experience during their service life. By applying and removing standardized adhesive tape across the cut area, you’re adding a consistent pulling force that further challenges the coating’s grip.
Significance of the Cross-Hatch Pattern
The cross-hatch pattern (perpendicular cuts forming a grid) serves specific technical purposes in the test procedure. This grid creates small squares of coating that are partially isolated from surrounding material.
The standard grid pattern ensures test consistency across different laboratories and technicians. You can reliably compare results because the pattern creates uniform stress distribution across the test area.
The size of the grid squares (usually 1mm, 2mm, or 3mm spacing depending on coating thickness) is calibrated to the coating system being tested. Thicker coatings require wider spacing to prevent false failures due to mechanical cutting effects rather than true adhesion problems.
The pattern also helps identify directional weaknesses in adhesion that might occur in only one orientation.
Visual Interpretation of Results
The ISO 2409 standard establishes a clear 0-5 classification system for evaluating test results. You assess adhesion quality by examining how much coating material detaches after tape removal.
Grade 0 indicates perfect adhesion with no detachment, while Grade 5 shows severe adhesion failure with more than 65% of the area affected. This numerical scale provides an objective way to communicate coating performance across different industries.
You should examine the cut edges under good lighting, looking for smoothness and cleanness. Jagged or rough edges might indicate brittleness or poor cohesion within the coating itself rather than adhesion failure.
Photographic documentation of test results helps maintain records and allows for comparison over time or between different coating systems.
Materials and Products Covered by ISO 2409

ISO 2409 applies to a specific range of coating systems and substrates when evaluating adhesion properties through cross-cut testing. The standard’s scope encompasses various paint types, varnishes, and related products that form dry film coatings on appropriate surfaces.
Applicable Coating Types
ISO 2409 is designed to test single-coat and multi-coat paint systems. It works effectively with conventional air-drying paints, stoving paints, and two-component paints. The standard also covers powder coatings, varnishes, and lacquers applied to surfaces.
Water-based coatings fall within the scope, as do solvent-based systems. Specialized coatings like automotive finishes, industrial protective coatings, and decorative paints can all be evaluated using this method.
The standard works best with coatings of specific thicknesses: 0-60 μm (using six cuts with 1 mm spacing) and 61-120 μm (using six cuts with 2 mm spacing). Coatings exceeding 250 μm are typically not suitable for this test method.
Substrate Compatibility
ISO 2409 can be performed on both rigid and non-rigid substrates. Common rigid substrates include metal panels (steel, aluminum, zinc), glass, concrete, and rigid plastics. Wood substrates may be tested if they have sufficient density and smoothness.
Non-rigid substrates like certain plastics and thin sheet metals can be tested with modifications to the procedure. The standard works best on flat surfaces, though slightly curved surfaces may be accommodated with appropriate technique adjustments.
You should ensure substrate thickness is sufficient to prevent deformation during testing. The standard is most effective when the substrate has a smooth, clean surface free from contamination that might affect adhesion properties.
Limitations in Material Use
ISO 2409 is not suitable for coatings thicker than 250 μm, as these typically require different testing methods like pull-off adhesion tests. Textured coatings and those with deliberate surface patterns may produce misleading results.
The standard has limited applicability for testing on very soft substrates (like some foams or flexible plastics) that can deform during cutting. Highly porous materials may also produce unreliable results due to uneven coating penetration.
You should avoid using this test on surfaces where the substrate is significantly weaker than the coating adhesion. Temperature and humidity extremes during testing can affect results, so testing should be conducted under controlled conditions (23°C ± 2°C and 50% ± 5% relative humidity).
Industry Applications and Importance

The cross-cut test outlined in ISO 2409 serves as a critical quality control measure across various coating applications. This test helps manufacturers and end-users evaluate coating adhesion performance in real-world scenarios.
Automotive Coatings
In automotive manufacturing, the cross-cut test is essential for qualifying coating systems before they reach production. You’ll find this test regularly used to evaluate primer adhesion to metal substrates and the adhesion between base coats and clear coats.
Quality control technicians perform this test during development phases and in regular production sampling to maintain consistent standards. When automotive parts face extreme temperature variations, UV exposure, and chemical contact, proper coating adhesion becomes critical for long-term durability.
The test helps manufacturers detect potential coating failures before vehicles leave the factory. This preventative approach saves significant warranty costs and preserves brand reputation. Many automotive specifications require ISO 2409 compliance with specific passing classifications (typically 0 or 1) for production approval.
Protective and Industrial Finishes
For industrial applications, coating adhesion directly impacts equipment longevity and safety. You can use the cross-cut test to evaluate protective coatings on:
- Oil and gas infrastructure
- Chemical processing equipment
- Marine vessels and offshore structures
- Heavy machinery components
These environments expose coatings to harsh chemicals, salt spray, and mechanical stress. Poor adhesion in these settings can lead to corrosion, equipment failure, and safety hazards.
The test provides valuable data for maintenance scheduling. When testing reveals declining adhesion scores, you can plan recoating before catastrophic failure occurs. Many regulatory bodies and insurance companies require documented adhesion testing for compliance with safety standards in industrial settings.
Architectural and Decorative Paints
When developing paints for buildings and homes, manufacturers rely on cross-cut testing to ensure lasting performance. You’ll want coatings that maintain adhesion through daily wear, cleaning, and environmental exposure.
The test helps evaluate paint performance on:
- Different substrate materials (wood, drywall, concrete)
- Various environmental conditions (humidity, temperature cycling)
- After accelerated aging tests
Paint manufacturers use these results to formulate products with optimal adhesion properties for specific applications. Architectural specifications often reference ISO 2409 requirements for projects where coating longevity is essential.
For renovation work, you can use this test to evaluate whether existing coatings need complete removal before repainting. This assessment prevents future adhesion failures and extends the life of your coating system.
How to Perform the ISO 2409 Cross-Cut Test

The ISO 2409 cross-cut test requires precise execution to accurately evaluate coating adhesion. This standardized method involves creating a lattice pattern on the coating surface and assessing how well the coating adheres after tape is applied and removed.
Essential Testing Equipment
To perform the ISO 2409 test correctly, you need specific tools:
- Cutting tool: A multi-blade cutting tool with defined spacing (1, 2, or 3 mm) based on coating thickness
- Cutting guide: A straight edge or template to ensure straight cuts
- Adhesive tape: Specified semi-transparent pressure-sensitive tape with adhesion strength between 6-10 N per 25 mm width
- Soft brush: For cleaning the cut area
- Illumination source: Good lighting to examine the test area
- Magnifying glass: 2x to 3x magnification for detailed inspection
- Reference images: The ISO 2409 classification scale (0-5) for result comparison
Sample Preparation Guidance
Proper preparation ensures reliable test results. Your test sample should be flat and at least 50 mm × 50 mm in size.
Conditioning the sample is crucial – maintain it at 23°C ± 2°C and 50% ± 5% relative humidity for at least 16 hours before testing. Clean the surface gently to remove contaminants without damaging the coating.
For factory-produced items, test the product as received. The coating thickness affects spacing selection: use 1 mm spacing for coatings up to 60 μm on hard substrates, 2 mm for 61-120 μm coatings, and 3 mm for coatings 121-250 μm thick on soft substrates.
Always check that the coating is fully cured according to manufacturer specifications before testing.
Understanding and Interpreting ISO 2409 Results

Proper interpretation of cross-cut test results is essential for evaluating coating adhesion performance accurately. The ISO 2409 standard provides a clear classification system that helps determine whether a coating meets quality requirements.
Grading Criteria Explained
ISO 2409 uses a 0-5 classification scale to rate adhesion quality. Grade 0 represents perfect adhesion with smooth cut edges and no detachment of coating squares. Grade 1 shows minimal detachment (less than 5% of the area) with small flakes at intersections.
Grade 2 indicates coating detachment along cut edges and intersections affecting 5-15% of the test area. Grade 3 shows more severe detachment (15-35%) with coating partially or completely removed in large strips.
Grade 4 represents significant detachment (35-65%) where squares detach partially or completely. Grade 5 is the worst result with any degree of detachment that exceeds Grade 4 (more than 65% affected).
Always examine the test area under good lighting. Take photographs when possible to document results for future reference or client reporting.
Implications for Product Quality
Test results directly indicate coating adhesion strength and overall durability. Grades 0-1 generally signal acceptable adhesion for most applications, though specifications may vary by industry.
Grades 2-3 suggest potential issues that might require process adjustments. These results often indicate problems with surface preparation, coating compatibility, or application techniques.
Grades 4-5 reveal severe adhesion failure requiring immediate corrective action. Products with these grades typically fail to meet industry standards and may experience premature coating failure in service.
You should always consider environmental exposure conditions when interpreting results. A coating that passes in laboratory conditions might still fail in harsh environments with temperature fluctuations, chemical exposure, or mechanical stress.
Industry-specific requirements may set different acceptance thresholds. Aerospace and automotive industries typically demand grades 0-1, while less critical applications might accept grade 2 results.
Best Practices for Implementing ISO 2409

Proper implementation of the cross-cut test requires attention to detail and consistent methodology. Following established best practices ensures reliable adhesion assessment results for your paint and coating systems.
Consistency and Repeatability
Always use calibrated cutting tools that meet the ISO 2409 specifications. Check the cutting edges regularly for damage or wear that might affect the test results. Replace blades when they show signs of dulling.
Control environmental conditions during testing. Maintain temperature between 20-25°C and relative humidity at 40-60% for optimal results. Record these conditions with each test for future reference.
Allow proper curing time before testing. Fresh coatings will give misleading results. Follow manufacturer’s recommendations for complete cure times, typically 7 days for most systems.
Use consistent pressure when applying the cutting tool. Too much force can damage the substrate; too little won’t penetrate the coating properly. Practice on similar test panels to develop consistent technique.
Common Challenges and Solutions
Irregular cutting patterns often result from improper cutting tool handling. Hold the tool at a steady 90° angle to the surface and maintain even pressure throughout the cut. Use a guide if necessary to ensure straight lines.
Substrate flexibility can affect results. For flexible substrates, support the back side during cutting to prevent deformation. Consider using the modified test parameters as described in ISO 2409 Annex A.
Difficult-to-interpret results may occur with textured coatings. Take multiple samples from different areas and average the results. Photograph test areas for documentation and comparison.
Brush selection affects tape application. Use brushes with medium-stiff bristles for proper surface contact. Brush in all directions to ensure good contact between tape and cut area before removal.
Comparison to Other Test Methods
ISO 2409 cross-cut test is one of several methods used to evaluate coating adhesion. Different test methods provide varying insights into coating performance based on specific testing mechanisms and evaluation criteria.
ISO 4624: Pull-Off Test
The ISO 4624 pull-off test measures adhesion strength quantitatively, unlike ISO 2409’s qualitative assessment. This test applies perpendicular tensile force to a dolly glued to the coating surface until detachment occurs.
You’ll find ISO 4624 particularly useful when you need precise numerical adhesion values (measured in MPa or psi). The test works well on thicker coatings (>250 μm) where cross-cut testing becomes less effective.
The pull-off test provides information about the weakest layer in the coating system, revealing whether failure occurs at the substrate-coating interface or between coating layers. However, you’ll need more specialized equipment compared to the simpler cross-cut test apparatus.
ASTM D3359: Tape Test
ASTM D3359 is the American equivalent to ISO 2409, with similar cross-cut methodology but different classification systems and procedures.
You can choose between two methods in ASTM D3359: Method A (X-cut) for thicker coatings and Method B (cross-hatch pattern) for thinner films. ISO 2409 only uses the cross-hatch approach.
ASTM D3359 employs a 0-5 rating scale, while ISO 2409 uses a 0-5 classification system with opposite meanings (0 is best in ISO 2409, while 5 is best in ASTM D3359). This difference can cause confusion when comparing results between standards.
Both standards are widely accepted, but you might encounter ASTM D3359 more frequently in North American industries and ISO 2409 in European markets.
Frequently Asked Questions
The ISO 2409 cross-cut test provides a standardized method for evaluating coating adhesion that helps manufacturers ensure product quality. This method uses specific techniques to assess how well paints and varnishes adhere to various substrates.
What is the purpose of the ISO 2409 standard in assessing the adhesion of paints and varnishes?
ISO 2409 provides a standardized method to evaluate how well a coating adheres to its substrate. The test helps determine if a coating will remain attached under normal use conditions.
This standard offers a quantitative rating system (0-5) that makes adhesion quality measurable and comparable. By creating controlled damage to the coating, you can observe how resistant it is to separation from the substrate.
The results allow manufacturers to make informed decisions about coating formulations and application methods before products reach consumers.
How does the cross-cut test contribute to maintaining quality control in the paint and coatings industry?
The cross-cut test serves as a crucial quality checkpoint during manufacturing. It provides immediate feedback about adhesion problems that might not be visible to the naked eye.
You can use this test to verify batch consistency and ensure production standards are maintained. When implemented regularly, it helps identify potential issues before products leave the facility.
The test’s simplicity makes it accessible for routine quality control without requiring complex equipment or extensive training.
For which types of coatings and substrates is the ISO 2409 cross-cut test commonly utilized?
ISO 2409 works well for testing rigid substrates like metal, plastic, and wood with coating thicknesses up to 250 μm. It’s particularly useful for evaluating industrial coatings, automotive finishes, and architectural paints.
The test is commonly applied to multi-layer coating systems to assess interlayer adhesion properties. You’ll find it widely used in industries where coating durability is critical, such as automotive, aerospace, and construction.
This method isn’t recommended for textured coatings, very soft substrates, or coatings thicker than 250 μm, as these require different testing approaches.
What are the core principles that underline the methodology of the ISO 2409 cross-cut test?
The test involves creating a lattice pattern of cuts through the coating down to the substrate. These cuts are made at right angles to form a grid of small squares.
After cutting, you apply and remove standardized adhesive tape over the grid. The principle behind this method is that poorly adhered coatings will detach when the mechanical stress of cutting is combined with the pulling force of the tape.
The evaluation focuses on how much coating detaches from the squares, with ratings from 0 (perfect adhesion) to 5 (severe detachment). This provides a quantifiable measure of adhesion quality.
How do the results of the ISO 2409 cross-cut test impact product development and quality assurance in the paints and varnishes sector?
Test results directly influence formulation adjustments during product development. When poor adhesion is detected, chemists can modify binder systems, surface preparation methods, or application techniques.
You can use these results to establish specification requirements for your products. Companies often set minimum acceptable ratings (typically 0-2) that products must meet before market release.
The data collected helps track performance over time and across different environmental conditions. This information proves valuable for warranty claims and product improvement initiatives.
Can you contrast ISO 2409 with other similar adhesion testing methods and detail the scenarios where it is most appropriately applied?
ISO 2409 differs from the pull-off test (ISO 4624) in that it assesses lateral adhesion rather than direct tensile strength. The cross-cut method works better for routine quality control, while pull-off testing provides more quantitative strength measurements.
Unlike the scratch test method, which evaluates progressive failure, the cross-cut test provides a snapshot of adhesion quality at a specific point. You should choose the cross-cut test when you need quick, visual assessments without specialized equipment.
The cross-cut method is most appropriate for thin to medium coatings on rigid substrates during manufacturing quality control. For critical applications or scientific research, you might need to complement it with other methods like ASTM D3359 tape test or more sophisticated analytical techniques.
- Δημοσιεύθηκε στο ISO Test Standards, Science and Research
ISO 4324:1977 – Measurement of the Angle of Repose: Evaluating Material Flow Properties in Bulk Solids Handling
ISO 4324:1977 is a standard that measures how powders and granular materials pile up when poured. When you work with bulk materials like sand, flour, or pharmaceutical powders, knowing the angle of repose helps predict how these materials will behave during storage, transportation, and processing. This measurement is crucial for engineers designing hoppers, silos, and conveyor systems because it directly impacts flow properties and handling requirements.

The test itself is quite simple but provides valuable data. You place material onto a flat surface and measure the angle formed by the pile’s slope. Materials with a low angle of repose flow more freely, while those with steeper angles tend to clump and resist flow. Industries from mining to food production rely on this standard to ensure consistent product quality and safe material handling.
Unlike similar tests such as shear cell testing or flow function measurements, the angle of repose test requires minimal equipment and can be performed quickly in many environments. You can use this test as a quality control measure or as an initial screening tool before conducting more complex flow property analyses. The results help you select appropriate processing equipment and prevent costly flow problems before they occur.
Key Takeaways
- The angle of repose measurement helps predict how powders and granular materials will flow during industrial processes.
- You can use ISO 4324:1977 test results to properly design storage equipment and prevent material handling problems.
- This standard offers a simpler alternative to complex flow tests while still providing valuable information about material behavior.
Overview of ISO 4324:1977 – Measurement of the Angle of Repose

ISO 4324:1977 establishes a standardized method for measuring the angle of repose of powdered or granular materials. This international standard provides valuable guidelines for material characterization in various industries.
Purpose and Scope
The primary purpose of ISO 4324:1977 is to define a consistent method for determining how powders and granular materials stack or pile up. This test helps you understand the flow properties of materials, which directly impacts handling, storage, and processing operations.
The scope covers a wide range of materials including pharmaceuticals, food ingredients, construction materials, and industrial chemicals. You can use this standard to evaluate both cohesive materials that tend to stick together and free-flowing materials that pour easily.
By measuring the angle of repose, you gain insights about material behavior during industrial processes. This information is particularly valuable when designing storage bins, hoppers, and conveying systems where material flow is critical.
Definition of the Angle of Repose
The angle of repose is the steepest angle at which a pile of loose material remains stable without sliding. It’s measured in degrees from the horizontal plane.
When you pour a granular material onto a flat surface, it forms a cone-shaped pile. The angle between the slope of this pile and the horizontal surface is the angle of repose.
Several factors affect this measurement:
- Particle size and distribution
- Particle shape
- Surface roughness
- Moisture content
- Πυκνότητα
A lower angle of repose (typically below 30°) indicates good flowability. Materials with angles above 45° generally have poor flow properties and may require special handling systems.
Relevance to Industry Standards
ISO 4324:1977 serves as a foundation for many industry-specific standards that evaluate powder and granular material behavior. You’ll find references to this methodology in pharmaceutical, food safety, and construction material guidelines.
The test results help you comply with quality control requirements in regulated industries. For example, pharmaceutical manufacturers use angle of repose measurements to ensure consistent tablet production.
This standard complements other material characterization tests like:
- Bulk density (ISO 3923)
- Particle size distribution (ISO 13320)
- Flowability tests (ISO 4490)
While newer methods have been developed since 1977, the angle of repose measurement remains valuable for its simplicity and reliability. You can perform this test with minimal equipment while still obtaining meaningful data about material handling properties.
Specific Use and Purpose of the Standard

ISO 4324:1977 establishes methods for measuring the angle of repose of materials. This standard helps evaluate flow properties and material handling characteristics crucial for various industrial applications.
Intended Application Areas
The angle of repose test applies to granular, powdered, and bulk solid materials. You’ll find this test particularly useful when working with pharmaceutical powders, food products, mining materials, construction aggregates, and chemical compounds.
Materials like coal, grain, sugar, fertilizers, and cement often require angle of repose measurements. This test is especially valuable for materials that must flow freely through hoppers, chutes, or conveyor systems.
Industries that rely on bulk material handling need this standard to predict how materials will behave during storage and transport. Testing helps you determine if special handling equipment or procedures are needed.
Objectives of Measurement
The primary objective is to quantify the internal friction of loose material. By measuring the angle formed when material piles naturally, you gain insight into its flow characteristics.
The test helps you:
- Predict flow behavior in storage containers and processing equipment
- Evaluate cohesion and adhesion properties of particles
- Determine minimum hopper angles needed for reliable discharge
- Assess potential for bridging or arching in silos and bins
This measurement serves as a simple yet effective quality control tool. You can compare new batches against established benchmarks to ensure consistent material properties.
Critical Role in Industrial Processes
Angle of repose measurements directly impact equipment design and operational efficiency. When you know how steep surfaces must be for materials to flow, you can design appropriate storage and handling systems.
In pharmaceuticals, this test helps ensure tablet manufacturing runs smoothly. Proper powder flow prevents inconsistent die filling and tablet weight variations.
For mining and construction, knowing the angle of repose helps you:
- Calculate safe stockpile heights
- Design appropriate conveyor systems
- Prevent unexpected material slides
The test also aids in troubleshooting flow problems. If materials suddenly behave differently, a change in angle of repose can signal moisture content changes or particle size distribution shifts.
Industries and Materials Applicable to ISO 4324:1977

ISO 4324:1977 serves as a standardized method for measuring the angle of repose across multiple industries where material flow properties are critical. This test is particularly valuable for powders, granules, and bulk solids that need predictable handling characteristics.
Types of Materials Evaluated
The angle of repose test primarily evaluates free-flowing particulate materials such as:
- Pharmaceutical powders: Including excipients, active ingredients, and granulations
- Food ingredients: Sugar, salt, flour, grain, coffee, and other dry food components
- Agricultural products: Seeds, fertilizers, and animal feed
- Industrial chemicals: Raw materials for manufacturing and processing
- Construction materials: Sand, cement, and other granular building components
- Mining products: Ore concentrates and crushed minerals
The test is most suitable for dry materials with particle sizes typically between 100 μm and 5 mm. Materials with excessive cohesiveness or very irregular particle shapes may show less consistent results.
Representative Industrial Sectors
You’ll find ISO 4324:1977 commonly used across several key industries:
Pharmaceutical manufacturing relies on this test to ensure consistent powder flow during tablet and capsule production.
Food processing industries use angle of repose measurements to design appropriate storage and conveying systems for ingredients.
Chemical processing facilities apply this standard to determine handling requirements for raw materials and finished products.
Mining and mineral processing operations utilize the test to predict material behavior during extraction, transport, and storage.
Agriculture depends on these measurements for designing silos, hoppers, and feed systems that prevent bridging or ratholing.
Criteria for Use of the Test
You should consider using ISO 4324:1977 when:
- Designing storage equipment like hoppers, bins, and silos to prevent flow problems
- Determining appropriate conveying methods for bulk materials
- Establishing quality control specifications for powdered or granular products
- Comparing flow properties between different material batches or suppliers
The test is most meaningful when performed under controlled environmental conditions. Factors like humidity (45-55% RH) and temperature (20-25°C) should be maintained for consistent results.
Material preparation is critical – you must ensure proper drying, sieving, or conditioning before testing. For materials with particle sizes below 100 μm, alternative flow tests like shear cell testing may provide more reliable data.
Principles Behind the Angle of Repose Measurement

The angle of repose measurement relies on fundamental physical principles that govern how granular materials behave when piled. These principles connect to both material properties and environmental conditions that affect test results.
Fundamental Scientific Concepts
The angle of repose represents the steepest angle at which loose material remains stable without sliding. This angle directly relates to the friction forces between particles that prevent them from sliding past each other.
When you measure angle of repose, you’re essentially quantifying the balance between gravitational forces pulling particles downward and the frictional forces holding them in place.
This measurement follows principles from soil mechanics and granular physics. The pile forms a conical shape because particles naturally distribute to minimize potential energy while maximizing stability.
The test works because granular materials seek their natural angle of internal friction when poured freely. This angle varies based on particle characteristics like shape, size, and surface texture.
Factors Influencing Results
Several factors can significantly affect your angle of repose measurements. Particle size distribution plays a crucial role – more uniform particles typically form more consistent angles than mixed sizes.
Moisture content dramatically influences results. Even small amounts of moisture can create cohesive forces between particles, increasing the measured angle. You should carefully control moisture when comparing different materials.
Surface roughness of individual particles affects friction coefficients. Angular, rough particles typically form steeper piles than smooth, rounded ones.
The method of pile formation matters too. Whether you form the pile by pouring, dumping, or other means can change your results by 5-10 degrees.
Environmental vibrations and air currents can destabilize piles during measurement. You should conduct tests in controlled environments to minimize these external influences.
Significance and Implications of Test Results

The angle of repose measurements provide critical information that influences material handling decisions and safety protocols. These results directly impact how you design storage systems and processing equipment.
Interpreting Measured Data
When interpreting angle of repose data, you should compare your measured values against established material benchmarks. Materials with angles below 30° typically flow freely, while those between 30-45° have moderate flow characteristics. Angles exceeding 45° indicate cohesive materials with poor flowability.
Repeatability is essential for reliable interpretation. You should conduct multiple measurements (typically 3-5 trials) and calculate the average value.
Variations exceeding ±2° between measurements suggest inconsistent material properties or testing conditions that require investigation.
Environmental factors like humidity and temperature significantly affect results. For example, a 10% increase in relative humidity can increase the angle of repose by 5-7° for hygroscopic materials.
Risk Assessment and Process Design
Your angle of repose measurements directly inform risk assessment protocols for material handling operations. Higher angles (>50°) indicate increased risk of flow problems such as bridging, ratholing, or unexpected avalanching in silos and hoppers.
You should incorporate safety factors in your designs based on repose angles:
- Low risk: Design angle = measured angle × 1.1
- Medium risk: Design angle = measured angle × 1.2
- High risk: Design angle = measured angle × 1.3
For process equipment design, the angle affects hopper geometries and conveyor specifications. Minimum hopper angles should exceed the material’s repose angle by 15-20° to ensure reliable discharge.
When designing transfer chutes, you should maintain the flow path angle at least 10° steeper than the repose angle to prevent material buildup and blockages.
Practical Examples and Typical Applications

The angle of repose testing outlined in ISO 4324:1977 finds practical use across numerous industries where bulk material handling is critical. These applications demonstrate the test’s value in real-world scenarios.
Common Sample Types
Pharmaceutical powders are frequently tested using this method. Active pharmaceutical ingredients and excipients need precise flow characterization to ensure consistent tablet production and capsule filling operations.
Fertilizer granules represent another common sample type. Manufacturers test these materials to optimize storage bin design and prevent flow problems during agricultural applications.
Food ingredients like sugar, salt, flour, and powdered milk undergo angle of repose testing. The results help food processors design appropriate handling equipment and storage containers.
Construction materials including cement, sand, and aggregates benefit from this testing. Their angle of repose values inform the design of hoppers, chutes, and conveyors used in concrete production facilities.
Industry Case Studies
A pharmaceutical company implemented angle of repose testing for a new antihypertensive drug powder. After discovering a high angle of repose (poor flowability), they added 0.5% silica as a glidant, reducing the angle from 45° to 38° and solving production bottlenecks.
Mining operations use angle of repose measurements to design appropriate stockpile configurations. One copper mine reduced material losses by 12% after redesigning their storage systems based on precise angle measurements.
Agricultural feed processing plants routinely test grain and supplement materials. A poultry feed manufacturer optimized their silo discharge mechanisms after determining the angle of repose for their specific formulations, reducing clogging incidents by 85%.
Food processors use these measurements to design packaging lines. A coffee producer improved filling accuracy by 23% after adjusting equipment based on angle of repose data for their ground coffee products.
Best Practices for Implementation and Interpretation

Proper implementation of ISO 4324:1977 requires attention to detail and consistent methodology. The following guidelines will help ensure your measurements are reliable and your interpretations are sound.
Recommendations for Reliable Assessment
Always use a standardized apparatus with proper calibration before testing. The funnel height should remain consistent between tests, as variations can significantly affect angle measurements.
Material preparation is crucial. Ensure your powder or granular material has consistent moisture content, as even small humidity changes can alter flow properties and angle results.
Take multiple measurements (at least three) and calculate the average angle. This reduces the impact of random variations in powder behavior.
Control the environment during testing. Temperature fluctuations and air currents can impact powder flow characteristics and distort your angle measurements.
Document all testing conditions thoroughly, including material properties, environmental factors, and equipment specifications for future reference.
Approaches to Result Validation
Compare your angle of repose measurements with other flow property tests like flow rate through an orifice or shear cell testing. Correlations between these methods strengthen your conclusions.
Establish control charts for materials you test regularly. This helps identify measurement drift or material changes over time.
Consider the practical implications of your measurements. An angle of repose below 30° typically indicates good flowability, while angles above 45° suggest poor flow characteristics.
Challenge your results by testing boundary conditions. Test the same material at different moisture levels or after storage to verify consistency.
Use reference materials with known angle of repose values to validate your testing methodology and equipment performance.
Comparison to Similar Standards and Test Methods
The angle of repose measurement exists across multiple testing frameworks, with ISO 4324:1977 being one of several approaches used globally. Different standards offer varying methodologies while serving similar analytical purposes.
Comparison with ASTM and Other ISO Standards
ASTM D6393 offers a comparable approach to measuring flow properties, including angle of repose, but focuses more on bulk powder behavior in pharmaceutical applications. You’ll find it includes additional parameters like compressibility and cohesion testing that ISO 4324 doesn’t address.
ISO 3435 provides methods for determining powder flowability but uses different apparatus configurations than ISO 4324. This creates some variability in results between standards.
The European Pharmacopoeia method (2.9.36) is often used alongside ISO standards in pharmaceutical contexts, providing a more specialized approach for medicinal powders with stricter validation requirements.
Distinctive Features and Limitations
ISO 4324:1977 stands out for its simplicity and reproducibility compared to alternatives. You can implement it with minimal equipment, making it accessible for routine quality control.
One limitation is its reduced accuracy with cohesive materials that don’t flow freely. For sticky powders or those with high moisture content, modified methods like ASTM D6128 (using rotating drums) may yield more reliable results.
Temperature and humidity sensitivity isn’t well-addressed in ISO 4324, while newer standards like USP <1174> incorporate environmental controls to improve consistency.
The fixed funnel height in ISO 4324 can be problematic for materials with varying particle sizes, whereas ASTM D6393 allows for adjustment based on material characteristics.
Frequently Asked Questions
The Angle of Repose measurement serves as a critical parameter in various industries for characterizing granular materials. This standard provides valuable insights into material flow properties, stability, and handling characteristics.
What are the primary applications of the ‘ISO 4324:1977 – Measurement of the Angle of Repose’ in industry applications?
The ISO 4324:1977 standard finds extensive applications in pharmaceutical manufacturing, where it helps determine powder flowability for tablet production. You’ll see it used in mining operations to assess the stability of material stockpiles and prevent dangerous collapses.
Food processing industries rely on this measurement to design proper storage and handling systems for granular ingredients. Construction material manufacturers use angle of repose data to determine how concrete aggregates, sand, and other materials will behave during transport and placement.
Agricultural industries apply this standard to optimize the design of grain silos and storage facilities. The test also proves valuable in chemical processing when handling and storing bulk solids.
How does the ‘Angle of Repose’ measurement contribute to understanding material properties and behavior?
The angle of repose directly indicates a material’s flowability—lower angles suggest better flow properties. You can use this measurement to predict how easily a material will form bottlenecks or bridges in hoppers and silos.
This parameter helps you understand internal friction between particles, which affects how materials will behave under various handling conditions. The measurement allows you to anticipate potential material segregation issues during transport or processing.
You can also use angle of repose data to estimate the stability of piles and heaps under different environmental conditions. The test reveals information about particle cohesion and adhesion properties that impact material handling equipment design.
Can you describe the types of materials or products for which the ‘ISO 4324:1977’ standard is most commonly utilized?
Pharmaceutical powders and granules are routinely tested using this standard to ensure consistent tablet production. Mining products like coal, ore, and mineral concentrates require angle of repose measurements for safe storage and transport.
Food ingredients such as sugar, salt, flour, and grain products benefit from this analysis for proper handling system design. Construction materials including sand, gravel, cement, and crushed stone are commonly evaluated using ISO 4324:1977.
Agricultural products like seeds, fertilizers, and animal feed rely on this test for storage facility design. Chemical industry materials such as catalysts, pigments, and polymer resins are frequently assessed using this standard.
What underlying principles of granular physics does the ‘ISO 4324:1977’ test method illustrate?
The test demonstrates the balance between gravitational forces and inter-particle friction that governs granular material behavior. You can observe how particle shape, size distribution, and surface roughness influence material stability and flow characteristics.
The standard illustrates the concept of critical angle—the maximum slope angle before material failure occurs. You’ll see principles of granular cohesion and adhesion in action during the test.
The method reveals how moisture content affects inter-particle forces and overall material behavior. The test also demonstrates how particle interlocking influences bulk material properties in granular systems.
What are the typical outcomes or conclusions drawn from the ‘ISO 4324:1977’ test method, and how do they inform industry practices?
Test results directly inform silo, hopper, and chute designs by establishing minimum slope angles needed for reliable material flow. You can use the data to select appropriate conveyance equipment and determine power requirements for material handling systems.
The measurements help you establish safe stockpile heights and slopes to prevent dangerous collapses. Quality control departments use these results to ensure batch-to-batch consistency of raw materials.
The findings allow you to optimize processing parameters such as blending times and mixing speeds based on flow properties. You can also predict potential handling problems before they occur, saving time and resources in production environments.
How does the ‘ISO 4324:1977’ method compare with other test methods for evaluating similar parameters in granular materials?
Unlike dynamic flow tests like the Hausner ratio or Carr index, the angle of repose provides a static measurement of material properties. You’ll find this method simpler and more economical than shear cell testing, though the latter offers more comprehensive flow property data.
The ISO standard provides better repeatability than informal pile tests due to its standardized methodology. Compared to flow function tests, angle of repose measurements require less specialized equipment and technical expertise.
You may notice this method focuses on bulk behavior rather than individual particle properties measured by other techniques. While less sensitive to minor variations than some modern instrumented methods, the ISO 4324:1977 test remains valuable for routine quality control.
- Δημοσιεύθηκε στο ISO Test Standards, Science and Research
ISO 14629:2012 Fine Ceramics: Evaluating Powder Flowability for Advanced Technical Applications
ISO 14629:2012 is a key standard for testing ceramic powders in advanced manufacturing. It provides a reliable method to determine how well these fine ceramic powders flow through a funnel-type apparatus. This property is crucial because it affects how powders behave during processing steps like die filling, making it essential for quality control and product development.

Understanding how ceramic powders flow helps manufacturers predict their behavior during production processes, ultimately leading to higher quality finished ceramic products. The standard applies to both granulated and ungranulated ceramic powders used in advanced technical applications, though it’s limited to powders that actually demonstrate flowability characteristics.
While similar to metal powder testing methods like ISO 4490, this standard is specifically designed for the unique properties of ceramic materials. By measuring flowability, engineers can better control production variables, reduce defects, and optimize manufacturing processes for components used in electronics, medical devices, and other high-performance applications.
Key Takeaways
- ISO 14629:2012 measures how well ceramic powders flow through a standardized funnel, providing critical data for manufacturing processes.
- The test results help predict powder behavior during production, improving quality control and reducing defects in advanced ceramic components.
- This standard differentiates itself from metal powder testing methods by specifically addressing the unique properties of ceramic materials.
Overview of ISO 14629:2012

ISO 14629:2012 provides a standardized method for measuring the flowability of ceramic powders. This test method helps manufacturers evaluate how well ceramic materials flow through production equipment, which directly impacts processing efficiency and final product quality.
Scope and Applicability
ISO 14629:2012 specifically addresses the determination of flowability for both granulated and ungranulated ceramic powders. The standard uses a specified funnel apparatus to measure how readily these materials flow under controlled conditions. This test is particularly relevant for manufacturers working with advanced ceramics and technical ceramic materials.
The standard falls under the ICS (International Classification for Standards) category 81.060.30, which covers advanced ceramics. Your quality control processes can benefit from this test when you’re evaluating raw materials for ceramic production or troubleshooting flow-related manufacturing issues.
The flowability measurement helps you predict how ceramic powders will behave during various manufacturing processes such as die filling, pressing, and molding operations.
Publication Date and Standardization
ISO 14629:2012 was officially published in 2012 by the International Organization for Standardization (ISO). This standard represents a consensus among ceramic industry experts and testing professionals worldwide.
The 2012 version remains current as of June 2025, indicating its continued relevance and applicability to modern ceramic manufacturing processes. ISO typically reviews standards periodically to ensure they remain technically relevant.
When you implement this standard in your testing protocols, you’re adopting a method that has undergone rigorous development and validation processes. The standardization ensures test results are comparable across different laboratories and manufacturing facilities.
International Relevance
As an ISO standard, ISO 14629:2012 enjoys global recognition and acceptance. This international relevance allows you to communicate test results reliably with suppliers, customers, and regulatory bodies worldwide.
The standard’s adoption across different countries helps harmonize testing methodologies in the ceramic industry. When you source materials from international suppliers or export ceramic products globally, this common testing language proves invaluable.
Many national standards bodies have adopted ISO 14629:2012 as their own standard, often without modification. This widespread acceptance makes it easier for you to maintain consistent quality control regardless of where your ceramic materials originate or where your products are sold.
The test method’s international recognition also supports global trade by reducing technical barriers related to material qualification and quality assurance.
Purpose and Importance of Determining Flowability

Flowability testing provides critical insights into how ceramic powders behave during manufacturing processes. This property directly impacts production efficiency, product quality, and overall manufacturing costs in the ceramics industry.
Why Flowability Matters in Fine Ceramics
Flowability measures how easily ceramic powders move through production equipment and molds. Poor-flowing powders can cause uneven filling of molds, leading to defects in the final product. When manufacturing advanced ceramics, consistent powder flow helps ensure uniform density distribution.
Different applications require specific flow characteristics. For example, high-precision components need powders with excellent and predictable flow properties. ISO 14629:2012 provides a standardized method to measure this critical property using a funnel test.
The test results help you select appropriate powders for specific manufacturing methods. Better flowability generally leads to more efficient production with fewer interruptions and less waste.
Implications for Industry and Applications
Understanding flowability helps you optimize manufacturing processes for advanced technical ceramics. When powders flow consistently, you can achieve faster production speeds and reduced downtime in automated systems.
Poor flowability can cause:
- Irregular filling of dies and molds
- Inconsistent product density
- Production bottlenecks
- Higher rejection rates
For complex-shaped components, flowability becomes even more critical. The powder must reach all areas of intricate molds without creating voids or density variations.
Industries like electronics, aerospace, and medical devices rely on fine ceramics with precise specifications. Your ability to control and predict powder flowability directly affects the reliability of these high-performance components.
Role in Quality Assurance
Flowability testing serves as an early warning system for potential manufacturing problems. Regular testing helps you maintain consistent production quality by detecting changes in powder characteristics before they affect your products.
Environmental factors like humidity can significantly impact flowability. By implementing ISO 14629:2012 in your quality control program, you can monitor these variations and adjust processing parameters accordingly.
The standardized nature of the test allows for:
- Clear communication between suppliers and manufacturers
- Consistent quality benchmarks
- Traceable documentation for regulatory compliance
Quality assurance departments use flowability data to approve incoming raw materials and troubleshoot production issues. This helps you maintain tight manufacturing tolerances required for advanced technical ceramics in critical applications.
Materials Covered by This Standard

ISO 14629:2012 specifically addresses the flowability testing of ceramic powders used in advanced ceramics manufacturing. The standard applies to both granulated and ungranulated ceramic powders that can flow freely through the specified test funnel.
Granulated Ceramic Powders
Granulated ceramic powders are composed of small particles that have been processed to form larger, more uniform granules. These powders typically flow more consistently than their ungranulated counterparts.
The standard is particularly useful for testing granulated powders used in pressing operations where flowability directly impacts mold filling uniformity. You’ll find these materials commonly used in the production of:
- Electronic components
- Industrial parts with complex geometries
- Structural ceramic components
When testing granulated powders, you should ensure they are dry and free from agglomerates that might block the funnel orifice. The test results help you predict how well these powders will perform in automated manufacturing processes.
Ungranulated Powders
Ungranulated ceramic powders consist of fine particles that haven’t undergone a granulation process. ISO 14629:2012 can evaluate these powders as long as they flow freely through the specified funnel orifice.
These materials include:
- Fine alumina powders
- Silicon nitride powders
- Zirconia powders
You should note that very fine ungranulated powders often exhibit poor flowability due to interparticle forces and may not be testable using this standard. For valid results, the ungranulated powder must flow completely through the funnel without assistance.
The standard helps you determine which ungranulated powders are suitable for specific forming processes where consistent flow is required.
Hochleistungskeramik
Hochleistungskeramik, the German term for high-performance ceramics, encompasses advanced ceramic materials with superior mechanical, thermal, or electrical properties. ISO 14629:2012 is particularly relevant for testing powders used in these high-performance applications.
These materials include:
- Technical ceramics for mechanical applications
- Electronic ceramics for electrical components
- Bioceramics for medical applications
When working with Hochleistungskeramik powders, you’ll find this standard valuable for quality control and process optimization. The flowability characteristics directly impact the final properties of sintered components.
The test results help you select appropriate powders for specific high-performance applications where precise powder flow behavior is critical for achieving consistent product quality.
Test Principles and Methodology

ISO 14629:2012 uses a simple yet effective approach to measure how easily ceramic powders flow. The test employs a standardized funnel system to evaluate flowability, which directly impacts manufacturing processes in the ceramics industry.
General Principles Behind the Test
The flowability test measures how quickly and consistently ceramic powder flows through a specified funnel. This property is crucial for manufacturing processes that require uniform powder distribution. Good flowability ensures even filling of molds and consistent product quality.
The test works on the principle of gravity flow. When ceramic powder is placed in the funnel, gravity pulls it downward through the orifice. The rate of flow depends on several powder characteristics including particle size, shape, density, and moisture content.
The time it takes for a standard amount of powder to flow completely through the funnel provides a quantitative measure of flowability. Shorter flow times indicate better flowability, while longer times suggest the powder may cause processing difficulties.
Components: Specified Funnel, Test Orifice, and Vat
The test equipment consists of three main components: a standardized funnel, a precisely sized test orifice, and a collection vat.
The specified funnel has a standardized shape with smooth interior walls to minimize friction. It’s typically made of polished metal to prevent powder from sticking to the sides.
The test orifice is the opening at the bottom of the funnel. Its diameter is precisely defined in the standard, as this significantly affects flow behavior. Different powders may require different orifice sizes for optimal testing.
The vat is positioned below the funnel to collect the powder after testing. It must be large enough to contain the entire sample without spillage.
A stopwatch or timer is also needed to measure the flow duration accurately.
Understanding the Test Method
To perform the test, you first close the orifice and fill the funnel with a specific amount of ceramic powder. The powder surface is carefully leveled without compaction.
When you open the orifice, the timer starts. You measure the time until the last of the powder exits the funnel. This measured time is the flowability value.
For reliable results, you should conduct multiple tests and calculate the average flow time. Environmental conditions like temperature and humidity should be controlled, as they can affect powder behavior.
Not all ceramic powders will flow freely through the funnel. Very fine or cohesive powders may form clumps or bridges that block flow. ISO 14629:2012 is only applicable to powders that flow naturally without assistance.
The test results help you predict how the powder will behave in production processes and can guide adjustments to powder formulations or handling procedures.
Applications and Typical Use Cases

ISO 14629:2012 serves as a critical standard for testing ceramic powder flowability using a specified funnel. This method helps manufacturers and researchers determine how easily powders will flow during production processes.
Industrial Settings and Sample Types
The flowability test specified in ISO 14629:2012 is primarily used in fine ceramics manufacturing facilities. You’ll find this method applied to both granulated and ungranulated ceramic powders before they enter production lines.
Common sample types include:
- Aluminum oxide powders
- Zirconia powders
- Silicon nitride powders
- Various ceramic composites
Testing labs and quality control departments regularly implement this standard to ensure consistency in raw materials. You can use this method for both incoming material inspection and during process development when formulating new ceramic compositions.
Impacts on Processing and Shipment
Poor powder flowability directly affects your manufacturing efficiency and product quality. When powders don’t flow consistently, you’ll experience:
- Irregular die filling
- Density variations in pressed parts
- Processing delays
- Increased rejection rates
During shipment of ceramic powders, flowability can change due to vibration, moisture absorption, or particle agglomeration. Testing upon receipt helps you identify potential issues before production begins.
For advanced technical ceramics, consistent flowability ensures uniform particle distribution in molds. This translates to fewer defects in final products and better mechanical properties. You’ll find that implementing this test standard reduces production costs through fewer rejected parts.
Interpreting Results and Best Practices

Proper interpretation of flowability data is essential for quality control in ceramic powder processing. Reliable results depend on consistent testing procedures and accurate evaluation of flow measurements.
Best Practices for Accurate Measurement
Always condition your ceramic powder samples at consistent temperature and humidity before testing. Variations in environmental conditions can significantly affect flowability results.
Ensure the funnel specified in ISO 14629 is clean and free from any residue that might impede powder flow. Even small obstructions can lead to inconsistent measurements.
Maintain a consistent powder mass for each test run. The standard recommends using 50g of powder for optimal results.
Perform at least three measurements for each sample to establish repeatability. If results vary by more than 5%, investigate possible causes such as powder agglomeration or moisture absorption.
Handle powders carefully to avoid compaction or aeration that could alter flowability characteristics prior to testing.
Evaluating and Reporting Flowability Data
Express flowability results in seconds as specified in ISO 14629, recording the time taken for the entire powder sample to flow through the funnel. Lower flow times indicate better flowability.
Compare your results with material specifications or historical data for similar ceramic powders. This context helps determine if the flowability is appropriate for your intended application.
Document all testing conditions, including:
- Ambient temperature and humidity
- Sample preparation method
- Any deviations from standard procedure
For non-flowing powders that exceed the maximum waiting time (typically 30 seconds), report as “no flow” rather than assigning an arbitrary time value.
Consider supplementing flowability data with angle of repose measurements for a more comprehensive understanding of powder behavior.
Comparison with Similar Standards

ISO 14629:2012 exists within a framework of related ceramic powder testing standards. These standards have evolved over time and offer alternative approaches to measuring powder characteristics.
Version Comparison and Updates
ISO 14629:2012 was reviewed and confirmed in 2023, indicating its continued relevance in the industry. The standard has maintained its core methodology since its first edition in 2012, showing stability in its approach to measuring ceramic powder flowability.
When comparing with earlier versions of powder testing standards, ISO 14629 represents an advancement in standardization specifically for fine ceramics. This focus on advanced ceramics distinguishes it from more general powder testing methods.
The confirmation in 2023 suggests that no significant technical changes were deemed necessary, validating the method’s continued effectiveness for modern ceramic manufacturing needs.
Alternative Test Methods
Several alternative methods exist for measuring powder characteristics that complement ISO 14629’s funnel-based flowability test:
- Hall Flow Meter Tests: Similar funnel-based approach but with different funnel geometry and primarily used for metal powders
- Angle of Repose Methods: Measure the angle formed by a cone of powder to determine flow characteristics
- Shear Cell Testing: Provides more detailed flow property data but requires more complex equipment
ISO 14629 is specifically designed for ceramic powders, while standards like ASTM B213 target metal powders. You might choose alternative methods when dealing with very cohesive powders that won’t flow through funnels or when more comprehensive flow property data is required.
Different industries often prefer specific standards based on historical precedent and specific material needs.
Availability and Accessing the Standard
ISO 14629:2012 is available through several official channels. You can purchase and access this standard through authorized distributors and the ISO website.
PDF Download and Official Sources
You can obtain ISO 14629:2012 directly from the International Organization for Standardization (ISO) official website (www.iso.org). The standard is available as a PDF download for a fee of approximately 58 Swiss Francs.
National standards bodies like ANSI in the United States, BSI in the United Kingdom, or DIN in Germany also provide access to this standard. Many universities and technical institutions offer access through their library subscriptions.
Technical libraries and industry associations sometimes provide member access to standards collections. If you work for a ceramics manufacturer, your company may already have purchased access rights.
The standard was last reviewed and confirmed in 2018, ensuring its continued relevance for ceramic powder testing applications.
Frequently Asked Questions
ISO 14629:2012 provides critical information for evaluating ceramic powder flowability in industrial applications. This standard helps manufacturers ensure quality control and predict processing behavior through consistent testing methods.
What is the primary purpose of ASTM ISO 14629:2012 in evaluating fine ceramics?
The primary purpose of ISO 14629:2012 is to determine the flowability of ceramic powders using a standardized funnel method. This test helps manufacturers assess how easily ceramic powders will flow during processing operations.
The standard applies to both granulated and ungranulated ceramic powders, though it only works with powders that can actually flow through the specified funnel.
By quantifying flowability, manufacturers can predict how powders will behave during forming processes and optimize production parameters accordingly.
How does the ISO 14629:2012 flowability test impact the advanced ceramics industry?
The ISO 14629:2012 test significantly improves quality control in advanced ceramics manufacturing. Companies can now consistently evaluate powder characteristics across different batches and suppliers.
This standardization leads to more reliable production processes and fewer defects in final ceramic components.
For research and development teams, the test provides valuable data for creating new ceramic formulations with optimized flow properties for specific applications.
Which categories of ceramic powders are typically analyzed using the ISO 14629:2012 standard?
Advanced technical ceramic powders used in high-performance applications are commonly tested with ISO 14629:2012. This includes materials for electronic components, biomedical implants, and industrial wear parts.
Both oxide ceramics (like alumina and zirconia) and non-oxide ceramics (like silicon nitride) can be evaluated using this method.
The standard is particularly valuable for testing spray-dried granulated powders used in pressing operations, where flowability directly impacts die filling uniformity.
Can you elucidate the fundamental principles that ISO 14629:2012 is based on?
ISO 14629:2012 measures flowability by timing how quickly a specific volume of powder flows through a standardized funnel. The faster the flow rate, the better the flowability of the powder.
The test relies on the principle that powder flow is influenced by particle size, shape, surface characteristics, and moisture content.
Gravity is the only force driving the powder flow during testing, creating a consistent measurement environment that eliminates variables from operator influence.
What are the implications of the results obtained from the ISO 14629:2012 flowability test?
Test results directly predict how ceramic powders will perform during manufacturing processes like die filling, tape casting, and injection molding. Poor flowability often leads to density variations and defects in finished parts.
Companies use these results to adjust formulations, adding flow aids or changing granulation parameters to improve processing characteristics.
The data also helps in selecting appropriate processing equipment and optimizing process parameters for specific powder types.
What are some best practices for conducting the ISO 14629:2012 test to ensure accurate interpretation of data?
Always condition powder samples in a controlled environment before testing to minimize the effects of humidity on flowability. Temperature and humidity should be recorded along with test results.
Maintain the testing funnel in perfect condition without scratches or dents that could affect flow patterns. Clean it thoroughly between tests to prevent cross-contamination.
Perform multiple measurements on each sample and calculate the average flow time for more reliable results. This helps account for natural variations in powder behavior.
- Δημοσιεύθηκε στο ISO Test Standards, Science and Research
ISO 3923-1:2018 Metallic Powders — Determination of Apparent Density: Essential Test Method for Quality Control in Powder Metallurgy Applications
ISO 3923-1:2018 plays a crucial role in the world of powder metallurgy by providing a standardized method for measuring the apparent density of metallic powders. This property tells you how much space a specific weight of powder occupies before any processing occurs. Understanding apparent density helps manufacturers predict how metallic powders will behave during handling, storage, and processing into final products like automotive parts, aerospace components, and medical implants.

When you work with metallic powders, their flowability and packing behavior directly impact your manufacturing process quality. ISO 3923-1:2018 uses a simple funnel flow method where powder flows through a standardized funnel into a cup of known volume. The test provides reliable data that helps you compare different powder batches, establish quality control measures, and ensure consistent production outcomes.
Key Takeaways
- ISO 3923-1:2018 measures how much space metallic powder occupies, which affects manufacturing quality and consistency.
- The standard applies to various metal powders used in industries like automotive, aerospace, and medical device manufacturing.
- Proper implementation of this test helps you predict powder behavior during processing and establish effective quality control systems.
Specific Use and Purpose of ISO 3923-1:2018

ISO 3923-1:2018 serves as an essential standardized method for measuring the apparent density of metallic powders. This property is fundamental for quality control and processing in powder metallurgy industries.
Definition of Apparent Density in Metallic Powders
Apparent density refers to the mass of a metallic powder divided by the volume it occupies when poured freely into a container of known volume. It’s expressed in grams per cubic centimeter (g/cm³).
This property is essentially a measure of how loosely or densely the powder particles pack together under gravity alone, without any applied pressure or vibration.
Unlike true density (which measures only the solid material), apparent density includes the spaces between particles. This makes it particularly useful for calculating the volume a specific mass of powder will occupy during manufacturing processes.
The measurement represents the powder in its most natural, uncompressed state – providing valuable baseline data for processing calculations.
Objectives and Scope of the Standard
ISO 3923-1:2018 specifically covers the funnel method for determining apparent density. This method applies to metallic powders that flow freely through a specified funnel.
The standard provides a consistent, repeatable procedure that allows for reliable comparisons between different powder batches and suppliers. This consistency is crucial for quality control in manufacturing.
You’ll find the standard includes precise specifications for equipment dimensions, ensuring that tests performed at different facilities yield comparable results.
While primarily used for metal powders, the principles can be applied to other free-flowing powder materials with appropriate modifications.
The standard excludes powders that don’t flow freely through the specified funnel, which would require alternative testing methods.
Why Apparent Density Matters in Powder Metallurgy
Apparent density directly impacts your manufacturing processes. When filling dies or molds, this property determines how much powder you need for a specific component.
It serves as a key quality control parameter, as variations in apparent density can indicate changes in particle size, shape, or distribution – potentially affecting the final product properties.
For inventory management, apparent density helps you calculate storage requirements and optimize material handling systems.
During powder blending operations, monitoring apparent density helps ensure mixture homogeneity. Significant changes may signal segregation or improper blending.
In production planning, accurate apparent density measurements allow you to predict material requirements and optimize process parameters. This improves efficiency and reduces waste.
The property also affects flow behavior during automated filling systems, where consistent apparent density is essential for maintaining dimensional precision in parts.
Principles Behind Apparent Density Measurement

Apparent density measurement provides crucial information about metallic powders by quantifying how particles pack together in a given volume. This property influences both processing behavior and final product characteristics in powder metallurgy applications.
Fundamental Concepts of Bulk and Particle Density
Apparent density represents the mass of powder per unit volume, including both the powder particles and the voids between them. This differs from true density, which measures only the material itself without spaces.
The ratio between apparent and true density gives the packing factor, indicating how efficiently particles fill space. Smaller particles typically pack differently than larger ones due to surface area effects and interparticle forces.
Particle shape also significantly impacts apparent density. Spherical particles generally flow better and pack more efficiently than irregular shapes, resulting in higher apparent density values.
Temperature and humidity can affect measurements by changing flow characteristics or causing agglomeration, which is why standardized testing conditions are essential for reproducible results.
How Flow Characteristics Affect Measurements
Flow behavior directly influences how powder fills the measuring vessel, affecting apparent density values. Poor-flowing powders may form bridges or rat-holes, creating inconsistent filling and unreliable measurements.
Cohesive forces between particles (like electrostatic or van der Waals forces) can cause agglomeration, reducing flow and creating variability in test results. You should control these factors through proper handling and conditioning.
Particle size distribution plays a key role in flow characteristics. Bimodal distributions often pack more efficiently than uniform sizes because smaller particles fill gaps between larger ones.
Factors affecting flow and apparent density:
- Particle morphology (shape and surface texture)
- Size distribution
- Surface chemistry
- Moisture content
- Environmental conditions
Testing method standardization is critical since even small procedural variations can significantly impact measurement results.
Industry Importance and Applications

Apparent density measurements serve as critical quality control parameters across multiple industries that rely on metallic powders. These measurements directly influence production decisions and final product performance.
Role in Powder Metallurgy Processes
Apparent density testing guides powder selection and processing parameters in powder metallurgy. When you choose powders with appropriate apparent density, you optimize die filling operations and achieve more consistent part dimensions.
Poor powder flow from inadequate apparent density leads to density variations in green compacts, causing defects in finished parts. This test helps you predict how powders will behave during automated press operations.
Quality control departments use apparent density values to verify incoming material consistency. When suppliers provide powders with consistent apparent density batch-to-batch, you can maintain reliable production settings without frequent adjustments.
Impact on Additive Manufacturing and Metal Injection Molding
In additive manufacturing, apparent density affects layer uniformity and build quality. Powders with optimal apparent density create more uniform powder beds in selective laser melting and electron beam melting processes.
Metal injection molding relies on precise apparent density measurements to formulate feedstock materials correctly. You’ll achieve better mold filling and fewer defects when using powders with appropriate apparent density values.
The test helps you identify powders suitable for specific equipment configurations. For example, certain 3D printing systems require powders within specific apparent density ranges to function properly with their recoating mechanisms.
Types of Materials and Samples Covered

ISO 3923-1:2018 specifically addresses metallic powders with defined characteristics and conditions. This standard applies to various powder types but has important limitations regarding flowability and particle characteristics.
Applicable Metallic Powders
ISO 3923-1:2018 covers a wide range of metallic powders used in powder metallurgy applications. This includes iron, steel, copper, aluminum, nickel, cobalt, tungsten, and their alloys in powder form.
The standard is particularly applicable to powders produced through atomization, reduction, or electrolysis methods. It’s commonly used for powders intended for press-and-sinter applications, metal injection molding feedstocks, and additive manufacturing materials.
The test method works best with powders having particle sizes typically between 20-250 μm, though this range isn’t explicitly limited by the standard.
Relevant Sample Conditions and Limitations
The key limitation of ISO 3923-1:2018 is that it applies only to free-flowing metallic powders. Non-flowing or poorly flowing powders require different test methods like ISO 3923-2, which uses the Scott Volumeter approach.
Sample conditions that affect testing include:
- Moisture content: Samples must be dry (typically <0.1% moisture)
- Storage time: Fresh samples preferred to avoid oxidation effects
- Θερμοκρασία: Testing at 23°C ± 5°C is recommended
- Agglomeration: Samples should be free from significant clumping
Powder shape also impacts testing—spherical particles generally flow better than irregular ones. The standard applies to both single-metal and pre-alloyed powders but not to composite or coated powders.
Interpreting Results and Their Implications

The apparent density values obtained through ISO 3923-1:2018 provide critical insights for powder metallurgy applications. Proper interpretation of these results directly impacts manufacturing decisions and final product quality.
Understanding Reported Apparent Density Values
Apparent density values are typically reported in g/cm³ or kg/m³ and represent how loosely or tightly the powder particles pack together. When examining your results, remember that higher values indicate better particle packing efficiency.
A well-controlled test should have a repeatability of approximately ±1.5% for most metallic powders. If your repeat measurements show greater variation, check your testing procedure for inconsistencies.
Different metal powders have characteristic apparent density ranges. For example:
- Iron powders: 2.3-3.0 g/cm³
- Copper powders: 2.0-5.5 g/cm³
- Aluminum powders: 0.9-1.5 g/cm³
Your results should be compared against supplier specifications or industry standards for your specific powder type.
Influence on Material Selection and Product Quality
Apparent density directly affects your powder’s flowability and compressibility—key factors in processing efficiency. Powders with too low apparent density may flow poorly and create inconsistent fills in die cavities.
When you select materials based on apparent density, you’re actually choosing how your production line will perform. Higher apparent density often correlates with better flowability, which means faster production rates and fewer defects.
Your final product properties are significantly influenced by apparent density. Components made from powders with optimal apparent density typically show:
- Better dimensional control
- More uniform strength
- Fewer structural defects
- Improved surface finish
Production engineers often use apparent density as a key acceptance criterion when receiving raw materials to ensure consistent manufacturing.
Best Practices for Implementation

Following proper implementation procedures ensures accurate and reliable apparent density measurements of metallic powders according to ISO 3923-1:2018.
Guidelines for Test Preparation
Always calibrate your equipment before testing. The density cup and funnel must be clean, dry, and free from dents or deformations that could affect volume measurements.
Control environmental conditions during testing. Maintain a temperature of 23±5°C and relative humidity below 60% to prevent moisture absorption by the powder.
Properly homogenize your powder sample before testing. Gently mix the powder in its container by rotating it for 30 seconds to ensure uniform distribution without compaction.
Use the appropriate funnel size based on your powder’s flow characteristics. For free-flowing powders, use the standard 2.5 mm orifice; for less flowable powders, the 5.0 mm orifice is recommended.
Recommendations for Reliable Data Interpretation
Record at least three measurements per sample and calculate the mean value. The standard deviation should be less than 2% of the mean for reliable results.
Compare your results with reference materials of known apparent density when possible. This helps validate your testing procedure and equipment performance.
Document all testing conditions thoroughly. Note the funnel size used, environmental conditions, and any deviations from standard procedure that might affect results.
Be aware of common result influences. Particle size distribution, moisture content, and surface oxidation can all affect apparent density measurements significantly.
When reporting results, always specify the test method (ISO 3923-1:2018) and funnel size used to allow proper comparison with other test results.
Comparison to Related Test Methods

ISO 3923-1 has several counterparts for measuring apparent density of metal powders. These methods vary in their equipment, sample preparation requirements, and specific applications within the powder metallurgy industry.
ASTM B212
ASTM B212 is the American equivalent to ISO 3923-1, focusing on determining the apparent density of free-flowing metal powders. This method uses a Hall flowmeter funnel with a 2.5 mm orifice and a density cup with a capacity of 25 cm³.
Key differences include:
- Standardization: ASTM B212 is primarily used in North America, while ISO 3923-1 is more common internationally
- Cup Specifications: ASTM B212 requires a 25 cm³ cup, while ISO 3923-1 specifies a 50 cm³ cup
- Το μέγεθος του δείγματος: You need less powder for ASTM B212 testing
Both methods share similar principles of allowing powder to flow through a standardized funnel into a calibrated cup. You’ll find ASTM B212 particularly useful when testing materials according to American specifications or when sample quantities are limited.
ISO 3923-2: Scott Volumeter Method
The Scott Volumeter method is designed for non-free-flowing metal powders that cannot pass through the Hall funnel used in ISO 3923-1.
Key characteristics include:
- Εξοπλισμός: Uses a series of baffles and screens rather than a funnel
- Powder Type: Ideal for irregular, coarse, or non-flowing powders
- Sample Distribution: Provides more consistent powder distribution for difficult materials
When you work with powders that are cohesive or have poor flowability, this method offers a reliable alternative. The Scott Volumeter creates a standardized powder bed by allowing the powder to cascade through a series of screens, reducing operator variability.
You should select this method when your metal powders fail the flow test required for ISO 3923-1 or when testing very fine powders that tend to agglomerate.
Frequently Asked Questions
ISO 3923-1:2018 establishes crucial methods for determining apparent density of metallic powders. These methods help manufacturers ensure quality control and product consistency across powder metallurgy applications.
What is the fundamental purpose of the ISO 3923-1:2018 standard for the determination of apparent density in metallic powders?
The fundamental purpose of ISO 3923-1:2018 is to provide a standardized method for measuring the apparent density of free-flowing metallic powders. This property represents the mass of powder that fills a unit volume under specific conditions.
Apparent density helps you understand how much space a given mass of powder will occupy during manufacturing processes. This information is critical for proper die filling in powder metallurgy operations.
The standard ensures consistent measurement techniques across the industry, allowing for reliable comparison of different powder batches and types.
How does the ISO 3923-1:2018 test contribute to quality control in the production and use of metallic powders?
ISO 3923-1:2018 serves as a critical quality control checkpoint in metallic powder production. By measuring apparent density consistently, you can detect variations in powder characteristics that might affect final product quality.
The test helps you identify potential issues early in the manufacturing process. Changes in apparent density often signal problems with particle size distribution, shape, or surface characteristics.
This standard enables you to establish specification limits for incoming raw materials. You can reject powder batches that fall outside acceptable density ranges before they enter your production process.
What types of materials and products are primarily tested using the ISO 3923-1:2018 standard, and why are they chosen?
ISO 3923-1:2018 primarily applies to free-flowing metallic powders used in powder metallurgy. This includes iron, steel, copper, aluminum, and various alloy powders.
These materials are chosen because their apparent density directly influences process parameters in press-and-sinter operations. The test is particularly important for powders used in structural PM components like gears, bearings, and automotive parts.
The standard is also applicable to metal powders used in metal injection molding (MIM) and additive manufacturing processes. In these applications, flow characteristics and packing behavior are essential quality attributes.
Can you outline the core principles that underpin the ISO 3923-1:2018 apparent density test for metallic powders?
The core principle of ISO 3923-1:2018 involves allowing powder to flow through a standardized funnel into a calibrated density cup. This mimics how powder would fill a die in actual production.
The test measures how powder particles arrange themselves under gravity without external compaction. This arrangement is influenced by particle size, shape, surface texture, and interparticle friction.
The apparent density is calculated by dividing the mass of powder in the cup by the known volume of the cup. This simple ratio provides valuable information about powder behavior during processing.
What are the expected outcomes of applying the ISO 3923-1:2018 test, and what implications might these results have for the industry?
The primary outcome of the ISO 3923-1:2018 test is a numerical value for apparent density, typically expressed in g/cm³. This value serves as a quality indicator for the powder batch.
Test results help you predict how powders will behave during die filling operations. Higher apparent density often indicates better flowability and more efficient packing, which can lead to more consistent part dimensions.
The industry uses these results to optimize process parameters such as press settings and sintering conditions. Adjustments based on apparent density measurements can reduce defects and improve final part properties.
What are some comparable test methods to ISO 3923-1:2018, and in what ways do they differ in terms of objectives and applications?
ASTM B212 is a similar test method for determining the apparent density of free-flowing metal powders. While it shares the same basic principle as ISO 3923-1:2018, minor differences exist in funnel dimensions and testing procedures.
ISO 3923-2:2018 measures apparent density of non-free-flowing metal powders using a Scott volumeter. You would choose this method when testing powders that don’t flow easily through the standard funnel.
Hall Flow tests (ASTM B213 or ISO 4490) often complement apparent density measurements. These tests focus on flowability rather than density but provide related information about powder behavior during processing.
- Δημοσιεύθηκε στο ISO Test Standards, Science and Research
ISO 4490:2018 Metallic powders — Determination of flow rate by means of a calibrated funnel (Hall flowmeter): Essential Quality Control Method for Powder Metallurgy Applications
When it comes to testing metallic powders in manufacturing, flow rate matters tremendously. ISO 4490:2018 provides a standardized method for measuring how quickly metallic powders flow through a calibrated funnel, known as a Hall flowmeter. This test is crucial for industries like powder metallurgy, additive manufacturing, and metal injection molding because powder flow properties directly impact production quality, consistency, and equipment performance.

The Hall flowmeter test helps you determine if your metallic powder will behave predictably during processing. Poor flowing powders can cause uneven distribution, density variations, and production delays. By measuring the time it takes for 50 grams of powder to flow through the standardized funnel, you get clear data about your material’s behavior under gravity flow conditions.
Key Takeaways
- ISO 4490:2018 measures metallic powder flow rate using a Hall flowmeter, providing critical data for quality control and production consistency.
- The test applies to various industrial powders including stainless steel, aluminum, and titanium alloys used in 3D printing and powder metallurgy.
- Proper implementation requires controlled environmental conditions and calibrated equipment to ensure accurate, reproducible results.
Overview of ISO 4490:2018 Metallic Powders Standard

ISO 4490:2018 establishes a standardized method for measuring how metallic powders flow through a calibrated funnel. This standard helps manufacturers ensure consistency in powder metallurgy processes across various industries.
Scope and Coverage
ISO 4490:2018 specifically addresses the determination of flow rate for metallic powders using a Hall flowmeter. The standard applies to a wide range of metallic powders, including those used in hard metals manufacturing.
It’s important to note that this method only works with powders that flow freely through the specified test orifice. Non-flowing or poorly flowing powders cannot be accurately tested with this method.
The standard covers metallic powders used in various applications including:
- Powder metallurgy components
- Hard metal production
- Additive manufacturing feedstock
- Metal injection molding materials
Key Objectives of the Standard
The primary goal of ISO 4490:2018 is to provide a reliable, repeatable method for measuring powder flow characteristics. Good flow properties are essential for consistent part production in powder metallurgy processes.
When you use this standard, you can:
- Quantify powder flowability objectively
- Compare different powder batches consistently
- Ensure manufacturing process reliability
- Predict powder behavior during production
The standard helps you maintain quality control by establishing baseline flow rate values. This allows you to quickly identify when powders deviate from expected performance characteristics, preventing costly production issues before they occur.
History and Development
ISO 4490 has evolved significantly since its initial development. The 2018 version represents the latest iteration, replacing the previous 2014 edition with important updates and clarifications.
The Hall flowmeter method itself dates back to the 1950s when it was developed by R.P. Hall for the aluminum powder industry. Over time, it became widely adopted for various metallic powders.
Key developments in the standard’s evolution include:
- Refinement of calibration procedures
- Clarification of testing conditions
- Improved precision statements
- Alignment with other international powder testing standards
The standard was developed through collaboration between industry experts, academic researchers, and standards organizations. This collaborative approach ensures the method remains relevant to current manufacturing practices.
Purpose and Significance of the Test

ISO 4490:2018 establishes a standardized method for measuring how quickly metallic powders flow through a calibrated funnel. This test provides critical information about powder behavior that impacts manufacturing processes and final product quality.
Evaluating Powder Flow Characteristics
The Hall flowmeter test quantifies a powder’s ability to flow consistently and predictably. When you test metallic powders using this method, you can determine if they will feed properly into dies or molds during production.
Poor flowing powders can cause inconsistent filling, leading to density variations and defects in finished parts. The test measures flow rate in seconds per 50 grams of powder, giving you a numerical value to compare different powder batches.
This standardized approach ensures that test results are consistent and reproducible across different facilities. You can use these results to establish specifications for powder acceptance and quality control.
Importance in Industrial Applications
In powder metallurgy and additive manufacturing, flow rate directly impacts production efficiency and part quality. When powders flow properly, you achieve more consistent packing density and fewer defects in your final products.
Industries using this test include:
- Automotive components manufacturing
- Aerospace parts production
- Electronics industry
- Medical device manufacturing
The test helps you select appropriate powders for specific applications. For example, complex parts with fine details require powders with excellent flow characteristics.
Testing according to ISO 4490 also facilitates communication between powder suppliers and users by providing a common language for powder specifications. You can use the results to troubleshoot production issues or validate new powder sources.
Specific Use Cases Across Industries

ISO 4490:2018 serves multiple critical functions across various sectors where metal powders are utilized. The flow rate measurement provided by this standard helps industries maintain consistent product quality and optimize manufacturing processes.
Powder Metallurgy and Additive Manufacturing
In powder metallurgy, flow rate directly impacts the efficiency of die filling operations. When you work with metal injection molding, powders with consistent flow properties produce parts with uniform density and fewer defects. This test is particularly valuable for determining whether your powder will perform reliably in automated production systems.
For additive manufacturing, the Hall flowmeter helps you predict how metal powders will spread in powder bed fusion processes. Powders with good flowability create more uniform layers, resulting in parts with better dimensional accuracy and mechanical properties.
Many 3D printing equipment manufacturers specify acceptable flow rate ranges measured per ISO 4490 in their material requirements. Testing your powders before use can help prevent costly production failures and inconsistent build quality.
Quality Control in Metal Powder Production
Metal powder producers use ISO 4490 as a critical quality control benchmark. The test allows you to verify batch-to-batch consistency before shipping products to customers. Many purchasing specifications include flow rate requirements measured by this standard.
When you’re developing new atomization processes, flow rate testing helps optimize production parameters. Factors like atomization gas pressure, melt temperature, and cooling rates all influence particle morphology and, consequently, flow behavior.
Common Flow Rate Specifications by Industry:
| Industry | Typical Flow Rate Requirement |
|---|---|
| Hard Metals | 16-22 s/50g |
| MIM Feedstocks | 25-35 s/50g |
| Additive Manufacturing | 15-25 s/50g |
Regular testing throughout your production cycle helps identify deviations before they become significant quality issues.
Relevance for Research and Development
R&D laboratories use the Hall flowmeter to correlate powder flowability with other properties. You can establish relationships between flow rate and particle size distribution, surface roughness, or humidity sensitivity for new alloy formulations.
When designing new powder handling equipment, flow rate data helps you size hoppers, feeders, and conveyors appropriately. Understanding how different powders flow through your system enables better equipment design.
Academic researchers often include ISO 4490 measurements when publishing new powder processing techniques. This standardized approach allows you to compare results across different research papers and institutions. The test provides a simple yet effective benchmark for assessing improvements in powder characteristics after treatments like plasma spheroidization or mechanical alloying.
Applicable Materials and Product Types

ISO 4490:2018 focuses on specific types of metallic powders for testing flow rates. This standard applies primarily to freely flowing powders used in powder metallurgy and has important limitations regarding particle characteristics.
Types of Metallic Powders Tested
The ISO 4490 standard is applicable to a wide range of metallic powders commonly used in powder metallurgy processes. These include:
- Base metal powders: Iron, copper, nickel, and aluminum powders
- Alloy powders: Stainless steel, bronze, and brass powders
- Hard metal powders: Tungsten carbide, titanium carbide powders
- Specialty metal powders: Used in additive manufacturing and 3D printing
The standard is particularly important for powders used in pressing and sintering operations. You’ll find this test method regularly employed for quality control in powder production facilities and by end-users who need consistent flow properties for their manufacturing processes.
Limitations in Material Applicability
Not all metallic powders can be tested using ISO 4490. Key limitations include:
- Flow requirement: Only applicable to powders that flow freely through the specified test orifice
- Non-applicable materials: Very fine powders, highly irregular shaped particles, and cohesive powders
- Particle size restrictions: Powders with large proportions of particles below 45 μm may not flow properly
The method is unsuitable for non-metallic powders or powder mixtures with non-metallic additives that significantly alter flow behavior. You should consider alternative testing methods like tap density or angle of repose measurements for powders that don’t meet these requirements.
Principles Behind the Hall Flowmeter Method

The Hall flowmeter method relies on fundamental physical principles that govern how metallic powders move under gravity. This standardized approach provides consistent measurements that help manufacturers assess powder quality and predict behavior during production processes.
Mechanism of Flow Rate Determination
The Hall flowmeter consists of a calibrated funnel with a specific orifice size through which metallic powder flows. When you conduct the test, you measure the time it takes for a standard mass (50g) of powder to flow completely through the funnel. The flow rate is calculated by dividing the powder mass by the elapsed time, giving results in seconds per 50g or g/s.
The funnel geometry is precisely defined in ISO 4490:2018, with a standardized angle and orifice diameter. This standardization ensures test results remain comparable across different laboratories and testing facilities.
Powder particles move through the funnel under gravitational force alone, without external pressure or assistance. The natural flow behavior reveals important characteristics about particle interaction and surface properties.
Factors Affecting Powder Flow
Particle size and distribution significantly impact flow behavior. Finer particles tend to flow more slowly due to increased surface area and interparticle friction. You’ll notice that powders with uniform particle sizes generally flow more consistently than those with wide size distributions.
Particle shape also plays a crucial role. Spherical particles typically flow more readily than irregular, angular, or flaky particles that can interlock and create resistance to flow.
Surface conditions affect interparticle friction. Moisture content, surface oxidation, and contaminants can dramatically alter flow characteristics. Even small amounts of moisture can cause particles to stick together, resulting in poor flow or complete blockage.
Powder density influences flow through gravitational effects. Denser powders exert more force, potentially improving flow rates if other factors remain equal.
Interpreting Test Results and Their Implications

The flow rate measurements obtained through ISO 4490:2018 provide critical insights into powder behavior during manufacturing processes. These results directly impact production efficiency and final product quality.
Typical Outcomes and Their Meaning
Flow rates are typically reported in seconds per 50 grams of powder. Faster flow rates (lower time values) generally indicate better flowability. A powder that flows in 20-30 seconds might be considered excellent for press feeding operations, while one taking 50+ seconds shows poor flowability.
Non-flowing powders that clog the funnel indicate very poor flowability. These results suggest the powder may need modification before use in automated processes.
Consistent flow rates between batches indicate good production control. Variations exceeding ±5% might signal process issues requiring investigation.
Results should always be evaluated against established specifications for your specific application. What’s considered “good” flow varies by industry and process type.
Influence on Downstream Processes
Flow rate directly affects powder feeding systems in manufacturing lines. Powders with consistent, moderate flow rates perform best in automated equipment, while erratic or slow-flowing materials can cause production stoppages.
Die filling uniformity in pressing operations correlates strongly with flow rate results. Well-flowing powders (25-35 seconds) typically produce more uniform pressed parts with fewer defects.
You can use flow rate data to predict:
- Press productivity rates
- Potential for density variations in components
- Need for flow additives or binders
- Suitability for specific application methods
Poor flow results might necessitate process adjustments like vibration assistance, flow agent addition, or particle size modifications before manufacturing can proceed efficiently.
Best Practices for Test Implementation and Data Analysis

Implementing ISO 4490:2018 effectively requires careful attention to sample preparation and consistent interpretation methods. Following established best practices ensures reliable flow rate measurements for metallic powders.
Optimizing Sample Preparation
Always handle powder samples with care to prevent contamination. Store samples in sealed containers before testing to avoid moisture absorption, as this can significantly affect flow properties.
Control the environmental conditions in your testing area. Temperature should be maintained at 23 ± 5°C and relative humidity below 65% for optimal results.
Pre-condition your samples by drying at an appropriate temperature if moisture content is a concern. For most metallic powders, 1-2 hours at 105°C is sufficient.
Use a standard sample size of 50g for most applications. Adjust this quantity only when specifically required by your application or when testing very dense materials.
Ensure your Hall flowmeter is properly calibrated and clean before each test series. Even small residues from previous tests can affect flow measurements.
Consistent Data Interpretation
Record flow rates in seconds per 50g of powder rather than g/s to maintain consistency with standard reporting formats. This makes your data comparable across laboratories.
Perform at least three measurements for each sample and report the mean value. Calculate the standard deviation to evaluate measurement reliability.
Be cautious when interpreting results for powders with flow rates exceeding 60s/50g, as these approach the limit of the method’s sensitivity.
Document all testing conditions with your results, including temperature, humidity, and any sample preparation steps. This context is crucial for proper interpretation.
Compare your results only with data collected using identical procedures. Small variations in methodology can lead to significant differences in measured flow rates.
Comparison with Other Powder Flow Standards
ISO 4490:2018 is one of several standards used to measure powder flow characteristics. Different industries and applications may require alternative testing methods based on specific needs.
Differences Between ISO 4490 and ASTM B213
ASTM B213 and ISO 4490 both use Hall flowmeters to measure metallic powder flow rates. However, ASTM B213 specifies a 0.1 inch (2.54 mm) orifice diameter, while ISO 4490 uses a 2.5 mm orifice. This small difference can affect test results.
The calibration procedures also differ. ASTM B213 requires calibration with standard reference materials, while ISO 4490:2018 includes a precision statement not found in earlier versions.
Sample preparation requirements vary between the standards. ASTM B213 has specific guidelines for sample conditioning, while ISO 4490 focuses more on the testing environment conditions.
Comparison with Flow Testing Alternatives
Beyond funnel methods, other powder flow testing standards include angle of repose measurements, where powders form conical piles whose angles indicate flowability. This method is simpler but less precise than Hall flowmeter tests.
Shear cell testing (ASTM D7891) measures internal friction and cohesion in powders. It provides more comprehensive data but requires more sophisticated equipment than ISO 4490.
Hausner ratio tests measure the ratio between tapped and untapped powder density. This method evaluates compressibility rather than direct flow characteristics.
Vibrating spatula methods are used for cohesive powders that don’t flow freely through funnels. These powders would be unsuitable for ISO 4490 testing, which specifically states it only applies to freely flowing materials.
Frequently Asked Questions
ISO 4490:2018 provides critical information about metallic powder flow properties. Understanding this standard helps manufacturers produce consistent products and solve common testing challenges.
What is the significance of the ISO 4490:2018 test method in evaluating metallic powders, and why is it considered critical in the industry?
The ISO 4490:2018 test method measures how easily metallic powders flow through a standard funnel. This property directly affects manufacturing processes like powder metallurgy, additive manufacturing, and hard metal production.
Flow rate testing helps predict how powders will behave during processing. Poor flowing powders can cause inconsistent part quality, equipment jams, and production delays.
The test is critical because it serves as a universal benchmark across the global metals industry. It allows manufacturers to specify exact flow requirements when purchasing raw materials.
How does the ISO 4490:2018 Hall flowmeter test contribute to quality control and assurance in the manufacturing of metallic powders?
The Hall flowmeter test provides a simple, repeatable way to verify powder consistency between batches. Quality control teams can quickly identify powders that deviate from specifications.
When implemented in a regular testing schedule, the test helps detect changes in powder properties before they cause manufacturing problems. This early detection saves time and reduces waste.
The test results create valuable documentation for quality systems and customer certifications. Many industry standards require flow rate testing as part of comprehensive quality assurance programs.
On what types of metallic powders is the ISO 4490:2018 flow rate determination test applicable, and what does it reveal about the properties of these materials?
The test applies to freely flowing metallic powders, including those used for hard metals. Common examples include iron, steel, aluminum, copper, titanium, and various alloys used in powder metallurgy.
ISO 4490:2018 is limited to powders that can flow unassisted through the specified test orifice. Very fine, cohesive, or irregularly shaped powders may not be suitable for this method.
The test reveals important information about particle shape, size distribution, and surface characteristics. Fast-flowing powders typically have spherical particles with smooth surfaces and narrow size distributions.
Can you elaborate on the general principles that underlie the ISO 4490:2018 test method and how the test’s results influence material usage?
The test uses gravity to move powder through a calibrated funnel while measuring the time required for a standard mass to flow completely. The design creates consistent testing conditions for reliable comparisons.
Results are typically reported in seconds per 50 grams of powder. Lower values indicate better flowability, while higher values suggest potential processing difficulties.
These results help manufacturers determine optimal processing parameters. For example, a powder with excellent flow properties might allow faster production speeds or the use of smaller feed openings in equipment.
What are some examples of the real-world application of the ISO 4490:2018 standard, and which industries rely on this test most heavily?
Additive manufacturing companies use flow testing to qualify metal powders for 3D printing. Consistent flow ensures even powder bed formation and ultimately more reliable printed parts.
The automotive industry relies on this test when producing powdered metal components like gears and bearings. These parts require precise powder flow for consistent density and strength.
Medical device manufacturers use ISO 4490:2018 when testing titanium and cobalt-chrome powders for implants. The high standards in this industry make flow testing essential for regulatory compliance.
What are the best practices for conducting the ISO 4490:2018 test, and how should one accurately interpret the results obtained from this method?
Always use a properly calibrated Hall flowmeter with the correct orifice size. Clean the equipment thoroughly between tests to prevent contamination.
Control the testing environment by maintaining consistent temperature and humidity. These factors can significantly influence powder flow properties.
When interpreting results, compare values to historical data and specifications rather than judging single measurements. Establish acceptable ranges based on your specific manufacturing processes.
Look for trends in flow rate changes over time. Gradual increases might indicate moisture absorption or particle degradation, while sudden changes could suggest problems with powder production.
- Δημοσιεύθηκε στο ISO Test Standards, Science and Research
ISO 1518 Scratch Test Method for Paints and varnishes — Determination of scratch resistance
When it comes to testing the durability of paint and varnish coatings, few methods are as widely recognized as the ISO 1518 Scratch Test. This standardized method allows manufacturers and quality control specialists to measure how well a coating resists mechanical damage under controlled conditions. The ISO 1518 test method determines the scratch resistance of single coatings or multi-coat systems of paint, varnish or related products by applying a defined load to a stylus that moves across the surface.

The test works by creating a controlled scratch on the coating’s surface, revealing valuable information about its performance in real-world applications. Whether you’re developing new coating formulations or evaluating existing products, understanding this test helps you make informed decisions about coating quality and durability.
Key Takeaways
- The ISO 1518 Scratch Resistance Test uses a stylus under constant load to evaluate coating durability under defined conditions.
- Test results help you compare different coating systems and determine if they meet specific performance requirements for various applications.
- Proper preparation of test panels and calibrated equipment are essential for obtaining accurate and reproducible results when conducting the test.
Scope of ISO 1518
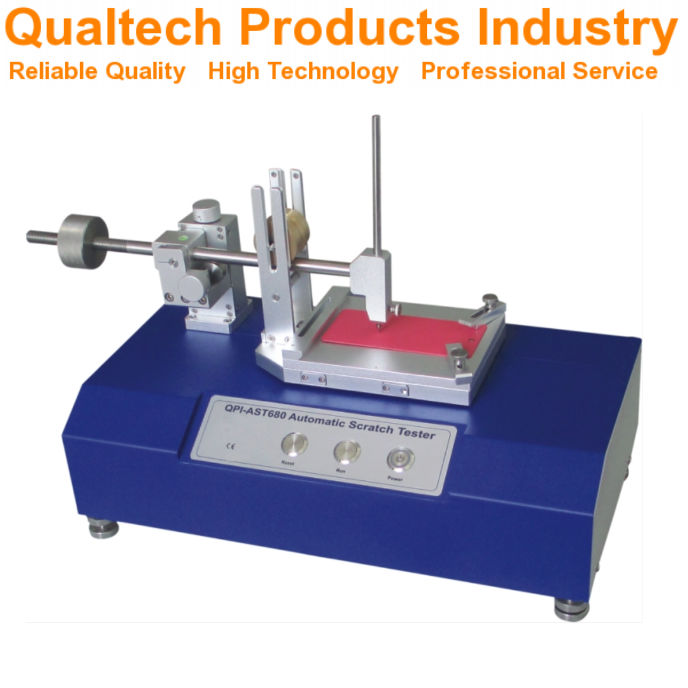

The ISO 1518 standard specifically focuses on determining the scratch resistance of paints and varnishes under defined conditions. This test method applies to both single coating applications and multi-coat systems.
You can use this method to evaluate various coating materials including paints, varnishes, and related products. The test helps you assess how well these coatings withstand mechanical damage from scratching.
The standard is divided into two parts. ISO 1518-1 covers the constant load method, while ISO 1518-2 addresses the variable load approach. Both provide standardized procedures for consistent testing.
When you conduct this test, you’ll be able to determine the minimum load at which visible damage occurs to the coating surface. This information is valuable for comparing different coating formulations and their durability.
The scope does not extend to other forms of mechanical resistance such as impact or abrasion testing. It is specifically designed for scratch resistance evaluation only.
This test method is applicable to laboratory samples as well as coated manufactured products. You can perform these tests on flat surfaces prepared according to the standard’s specifications.
Principles of the Scratch Test Method


The ISO 1518 scratch test evaluates a coating’s ability to resist mechanical damage by applying controlled pressure with a stylus. This method helps determine critical failure points of paint and varnish coatings.
Scratch Test Equipment
The test requires a scratch tester apparatus that consists of a hemispherical-tipped stylus and a loading mechanism. According to ISO 1518-1, the stylus is typically made of hardened steel with a tip radius of 0.5 mm. The apparatus must be capable of moving the stylus across the coating at a constant speed.
The loading mechanism applies a defined, stable force perpendicular to the coating surface. You’ll need a device to measure this force accurately, usually in newtons.
The equipment should also include a means to secure the test panel firmly to prevent movement during testing. Some advanced models include optical systems to observe and record the scratch formation in real-time.
Test Parameters Setup
Before conducting the test, you must properly configure several key parameters. The applied load is critical and can be adjusted incrementally to determine the threshold at which coating failure occurs.
The test speed must be kept constant, typically between 30 mm/s to 40 mm/s. This ensures consistent results across different test sessions.
Temperature and humidity conditions should be standardized, usually at 23°C ± 2°C and 50% ± 5% relative humidity unless otherwise specified.
Your test panels must be prepared according to specific requirements with uniform coating thickness. The surface should be clean and free of contaminants.
Rest time between coating application and testing is also important, typically minimum 7 days for air-drying paints or as specified in the product data sheet.
Preparation of Test Panels
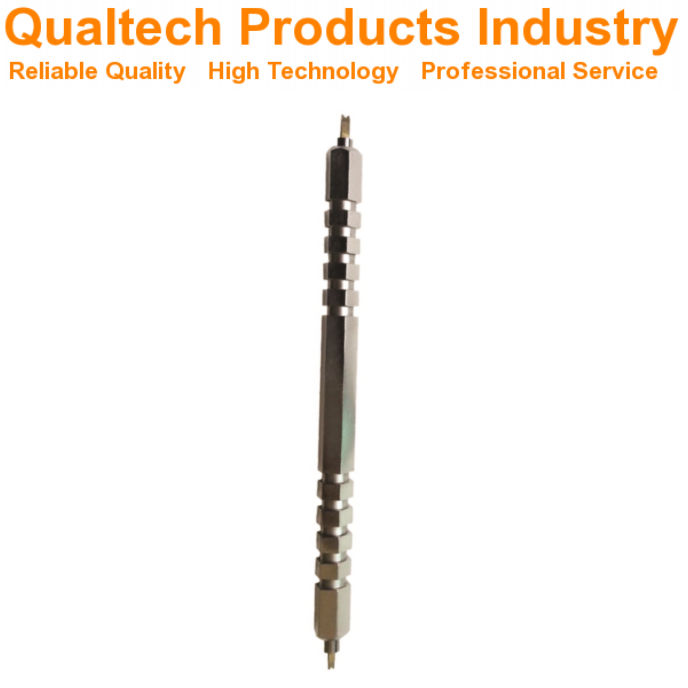

Proper test panel preparation is crucial for accurate ISO 1518 scratch resistance testing. You must select panels that match your real-world application requirements.
For standard testing, use flat metal panels made of steel, aluminum, or tin plate. These panels should be clean and free from any defects that might affect test results.
Before coating application, you must clean the panels thoroughly to remove grease, dust, and other contaminants. Wipe the surface with a suitable solvent like acetone or isopropyl alcohol, then allow it to dry completely.
Apply the coating (paint or varnish) to the test panel according to the manufacturer’s instructions. This includes following recommended application methods, thickness, and drying conditions.
Important panel specifications:
- Size: Typically 150 mm × 100 mm
- Thickness: Minimum 0.8 mm for metal panels
- Flatness: Panels must be flat without warping
The coating should be applied evenly across the entire panel. You may need to measure the dry film thickness to ensure uniformity using a suitable measurement device.
Allow the coated panels to dry and cure completely according to the test method specifications. This typically includes:
- Drying at room temperature (23 ± 2)°C
- Relative humidity (50 ± 5)%
- Minimum curing time of 7 days (unless otherwise specified)
Before testing, condition the panels at the standard testing temperature and humidity for at least 16 hours.
Performing the Scratch Test
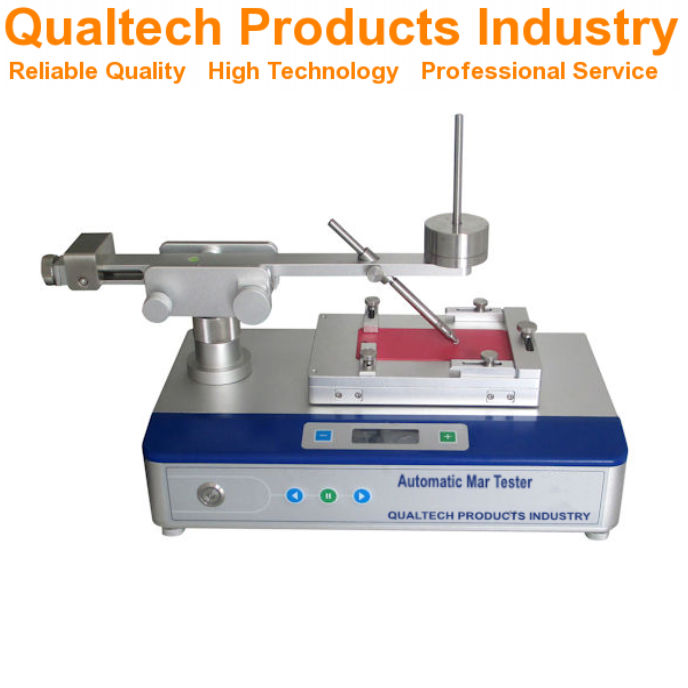

The scratch test requires careful execution to obtain reliable results. Proper technique and control of variables ensure consistent measurements of coating resistance to mechanical damage.
Applying the Scratch
To perform the scratch test according to ISO 1518, you must first secure your test panel firmly on a stable surface. The stylus tip should be positioned at one end of the intended scratch path.
Apply the predetermined constant load to the stylus. For the constant loading method described in ISO 1518-1, you need to select the appropriate weight based on coating type and expected performance.
Move the stylus across the coating at a steady speed of 30-40 mm/s. Maintain consistent pressure and angle throughout the test. The scratch should be approximately 10 cm long.
After completing the scratch, examine the resulting mark under good lighting conditions. Look for coating penetration down to the substrate, which indicates failure at that load level.
Control of Test Variables
Temperature and humidity significantly affect test results. You should conduct tests at 23 ± 2°C and 50 ± 5% relative humidity unless otherwise specified for specific coating types.
ο test apparatus must be calibrated regularly to ensure accurate loading. Check the stylus tip condition before each test session—damaged or worn tips can invalidate results.
Substrate preparation and coating application must be standardized. Record film thickness at multiple points across the test panel.
Key variables to control:
- Speed of stylus movement
- Applied load precision (±0.1N)
- Stylus tip geometry (1 mm hemispherical)
- Panel temperature
- Coating age (fully cured)
Evaluation of Scratch Resistance


After conducting the ISO 1518 scratch test, proper evaluation of the results is crucial for determining coating performance. The assessment involves both qualitative visual inspection and quantitative measurement techniques.
Visual Inspection Criteria
The visual inspection of scratch resistance follows specific criteria outlined in the ISO 1518 standard. You should examine the tested surface under good lighting conditions, preferably using a light source at 45° to the surface.
Look for the following key indicators:
- First visible scratch mark: The lowest load at which a continuous scratch becomes visible
- Penetration to substrate: The load at which the coating is penetrated to reveal the substrate
- Coating deformation: Any signs of cracking, flaking, or delamination
You must record the results in newtons (N) to the nearest 0.1 N. For multi-coat systems, note which layer has been exposed by the scratch.
Take photographs of the scratch patterns for documentation purposes if required by testing protocols.
Measurement of Scratch Width
The scratch width measurement provides quantitative data for comparing different coating formulations. You can measure scratch width using:
- Optical microscope: With calibrated reticle or digital measuring capability
- Προφίλόμετρο: For precise depth and width measurements
- Image analysis software: For automated measurement of scratch dimensions
Record measurements at several points along the scratch length, typically at 5 mm intervals. The standard testing procedure requires a minimum of five measurements to calculate an average width.
Express results in micrometers (μm) with appropriate precision. Higher quality coatings typically show narrower scratch widths at equivalent loads. Plot the scratch width against applied load to create a performance curve for comparative analysis.
Reporting Test Results

Accurate documentation of scratch resistance testing results is essential for quality control and product development. Proper reporting allows for meaningful comparisons between different coating formulations and helps determine if products meet required specifications.
Data Representation
When reporting ISO 1518 scratch test results, you should include both numerical and visual documentation. Record the critical load at which coating failure occurs in Newtons (N) for constant load tests according to ISO 1518-1. For variable load tests, document the minimum load that causes coating penetration.
Include photographs of the scratch patterns when possible. These provide visual evidence of the failure mode and help with future reference.
Create a standardized table format that includes:
- Sample identification
- Test date
- Applied load(s)
- Number of test repeats
- Mean critical load value
- Standard deviation
Each test report should clearly indicate which part of ISO 1518 was used (Part 1 or Part 2) as the test methodologies differ significantly.
Interpretation Guidelines
You should establish clear pass/fail criteria before conducting tests. Define the minimum acceptable scratch resistance value based on product specifications or industry standards.
When interpreting results, consider the following factors:
- Failure mode: Distinguish between complete penetration to substrate versus surface deformation
- Pattern consistency: Evaluate if failures occur uniformly or at random points
- Comparative analysis: Compare results against reference materials or previous batches
Note that higher critical load values indicate better scratch resistance. However, interpret results in context of the coating’s intended application environment.
Be careful not to overinterpret minor variations between samples. Statistical significance should be established before concluding meaningful differences exist. Consider environmental factors like temperature and humidity which may influence test outcomes.
Quality Control and Reproducibility

Ensuring reliable test results with the ISO 1518 scratch test requires strict quality control measures. This qualification is essential for industries where coating durability directly impacts product performance.
To maintain reproducibility, you must regularly calibrate your testing equipment. The scratching tool, particularly the hemispherically tipped needle mentioned in ISO 1518, requires inspection for wear or damage before each test session.
Environmental conditions play a crucial role in test consistency. You should conduct tests at standard temperature (23 ± 2°C) and relative humidity (50 ± 5%) unless otherwise specified.
Key Quality Control Factors:
- Equipment calibration
- Needle condition verification
- Consistent sample preparation
- Standardized environmental conditions
- Trained operators
Sample preparation techniques must follow the guidelines outlined in ISO 1518-1:2019. This includes proper curing time and uniform application thickness.
Test operators should receive thorough training on both equipment operation and result interpretation. Your interpretation criteria must be consistent across all testing personnel.
For multi-lab testing scenarios, round-robin testing helps verify consistency. You should establish acceptable variance ranges for your specific testing application.
Documentation is essential for quality assurance. Your records should include all test parameters, environmental conditions, and detailed observations of coating behavior during testing.
Maintenance and Calibration of Equipment

Proper maintenance and regular calibration of scratch test equipment ensure accurate and repeatable results when testing paint and varnish surfaces according to ISO 1518 standards. These practices are essential for maintaining the integrity of test data over time.
Routine Maintenance
Clean the scratch tool tip after each test to prevent cross-contamination between samples. Inspect the hemispherical tip regularly under magnification for signs of wear, deformation, or damage that could affect test results.
Replace the needle tip when any flattening or irregularities are observed, as this will compromise the validity of your scratch resistance measurements. Most manufacturers recommend tip replacement after approximately 100 tests.
Store the scratch tester in a dust-free environment and cover when not in use. Regularly check moving parts and loading mechanisms for smooth operation, applying appropriate lubricant as specified by the equipment manufacturer.
Wipe down guide rails and load-bearing surfaces monthly with a lint-free cloth. Examine the base plate for flatness and clean test surfaces thoroughly before mounting specimens to ensure proper contact.
Calibration Procedures
Calibrate your scratch tester at least every six months or after 500 tests, whichever comes first. Use certified reference materials with known scratch resistance values to verify equipment performance.
The load application system must be calibrated using certified weights traceable to national standards. Check that the applied force matches the displayed or set values within ±2% across the full range of test loads.
Calibration Check Points:
- Zero point verification
- Linear response across load range
- Speed control accuracy (5 mm/s ±0.5 mm/s)
- Horizontal movement stability
Maintain a calibration log documenting dates, procedures, results, and any adjustments made. When calibrating the scratch tip geometry, use a calibrated microscope to verify the 1 mm diameter hemispherical shape as specified in ISO 1518-1.
Record ambient conditions during calibration, as temperature and humidity can influence test performance. If your equipment fails calibration checks, contact the manufacturer for service before conducting further tests.
Safety Considerations

When performing the ISO 1518 scratch test for paints and varnishes, you should always prioritize safety. The test involves sharp instruments that could cause injury if mishandled.
Always wear appropriate personal protective equipment (PPE) during testing. This includes safety glasses to protect your eyes and gloves to protect your hands from sharp tools and chemicals.
The test may involve working with paints and varnishes that contain volatile organic compounds (VOCs). Ensure your testing area is well-ventilated to prevent inhalation of potentially harmful fumes.
Keep your workspace clean and organized. This reduces the risk of accidents and ensures accurate test results. Store all testing equipment properly when not in use.
Essential Safety Equipment:
- Safety glasses
- Protective gloves
- Lab coat
- Proper ventilation system
Be aware of the physical hazards associated with the testing apparatus. The scratch testing needles have sharp tips that can cause puncture wounds if mishandled.
When disposing of test samples and materials, follow local regulations for chemical waste disposal. Some coating materials may be classified as hazardous waste.
If you’re operating automated scratch testing equipment, ensure you’re familiar with the manufacturer’s safety instructions before use. Never bypass safety features on testing equipment.
Document any safety incidents during testing and review procedures regularly to prevent future occurrences. Your safety should always be the primary concern when conducting any laboratory testing.
Frequently Asked Questions

The ISO 1518 scratch test method includes specific parameters for measuring coating durability and resistance to mechanical damage. These common questions address testing equipment, applicable coatings, and result interpretation.
What types of coatings can be evaluated using the ISO 1518 scratch test method?
The ISO 1518 scratch test method can evaluate a wide range of coating materials. This includes single coatings or multi-coat systems of paint, varnish or related products.
You can test both decorative and protective coatings on various substrates. The method works well for automotive finishes, industrial coatings, and architectural paints.
What apparatus is required to conduct the scratch resistance test as per ISO 1518 standards?
The primary instrument needed is a scratch tester with a hemispherically tipped needle. This device must allow controlled application of force during the scratching process.
You’ll also need proper sample preparation tools and a means to measure the applied load. Some versions require a constant-load apparatus while others use a progressively increasing load mechanism.
How does the ISO 1518 method measure the scratch resistance of paints and varnishes?
The ISO 1518 method measures scratch resistance by drawing a hemispherically tipped needle across a coated surface under defined conditions. The test evaluates how well the coating withstands this mechanical stress.
You can observe at what load the coating begins to show damage. The higher the load required to produce visible damage, the better the scratch resistance of the coating.
What are the differences between ISO 1518-1 and ISO 1518-2 standards regarding scratch resistance testing?
ISO 1518-1 uses a constant load method where a specific weight is applied throughout the test. This provides a straightforward pass/fail assessment at predetermined loads.
ISO 1518-2 employs a variable load technique where force increases progressively during the test. This allows you to determine the exact load at which coating failure occurs.
How are scratch resistance test results interpreted under ISO 1518 guidelines?
Results interpretation depends on whether you’re using the constant load (ISO 1518-1) or variable load (ISO 1518-2) method. For constant load tests, you report whether the coating showed damage at each tested load.
For variable load tests, you record the minimum load that caused coating penetration. Higher numerical values indicate better scratch resistance properties.
Can ISO 1518 scratch test method be applied to both water-based and solvent-based coatings?
Yes, the ISO 1518 scratch test method works equally well for water-based and solvent-based coating systems. The test evaluates physical resistance properties regardless of the coating chemistry.
You can compare different coating technologies using this standardized approach. This makes it valuable for product development and quality control across various coating formulations.
- Δημοσιεύθηκε στο ISO Test Standards, Science and Research
- 1
- 2